


LUXEMBOURG / ACCESSWIRE / July 30, 2024 / Ternium S.A. (NYSE:TX) today announced its results for the second quarter and first half ended June 30, 2024.
The financial and operational information contained in this press release is based on Ternium S.A.'s operational data and consolidated condensed interim financial statements prepared in accordance with IAS 34 "Interim financial reporting" (IFRS) and presented in US dollars ($) and metric tons. Interim financial figures are unaudited. This press release includes certain non-IFRS alternative performance measures such as Adjusted EBITDA, Cash Operating Income, Net Cash, Free Cash Flow, Adjusted Net Income, Adjusted Equity Holders' Net Income and Adjusted Earnings per ADS. The reconciliation of these figures to the most directly comparable IFRS measures is included in Exhibit I.
Second Quarter of 2024 Highlights
Summary of Second Quarter of 2024 Results
1 American Depositary Share. Each ADS represents 10 shares of Ternium's common stock. Results are based on a weighted average number of shares of common stock outstanding (net of treasury shares) of 1,963,076,776.
Second Quarter of 2024 Highlights
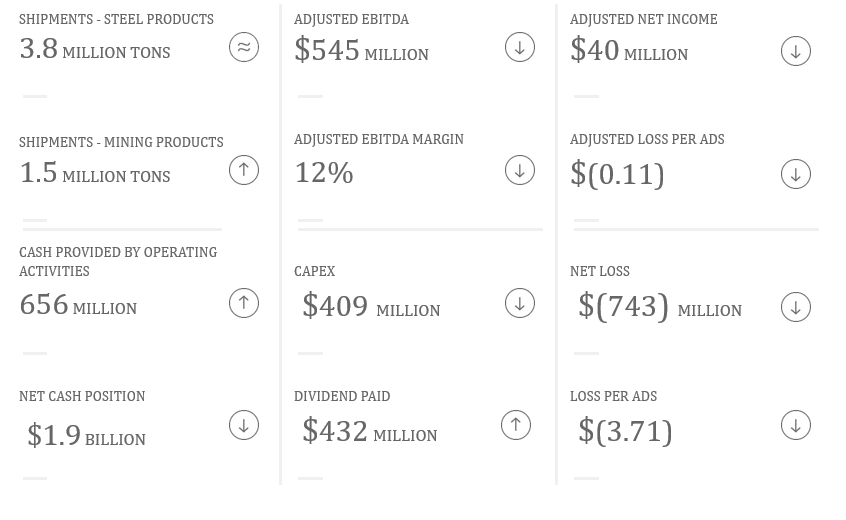
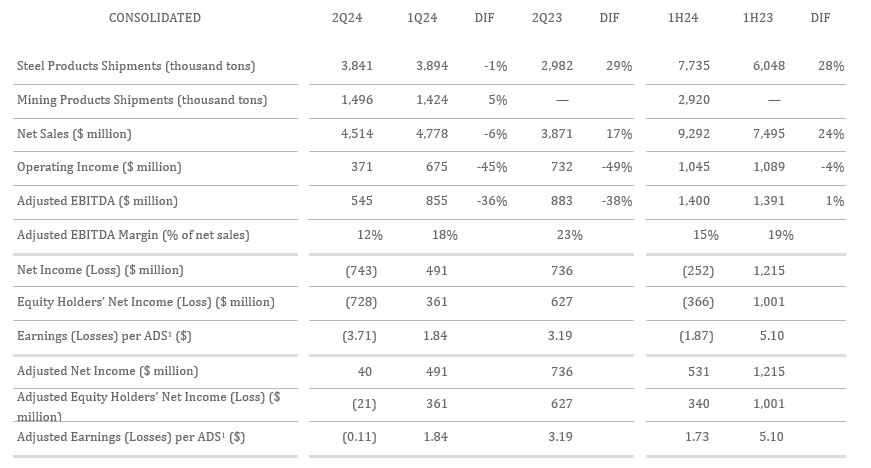
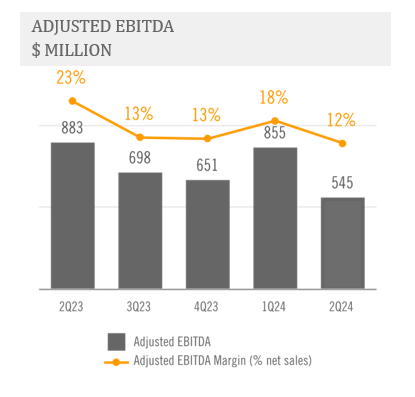
Ternium's Adjusted EBITDA reached $545 million in the period on Adjusted EBITDA Margin of 12%, with a relatively weak pricing environment in Ternium's main steel markets. Adjusted EBITDA decreased sequentially in the second quarter mainly reflecting lower realized steel prices and a slight increase in costs, as steel shipments remained relatively stable.
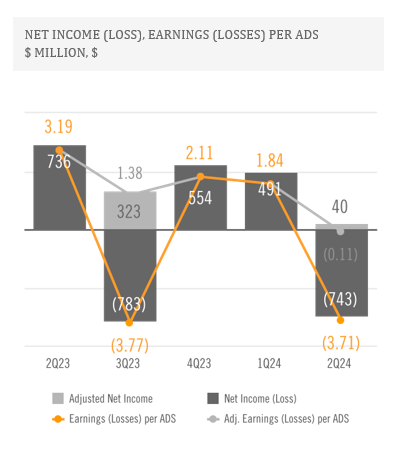
The company recorded in the second quarter of 2024 a $783 million provision for ongoing litigation related to the acquisition of a participation in Usiminas in 2012 as a result of an adverse Brazilian court decision issued in June 2024. Ternium believes that such decision is contrary to applicable substantive and procedural law; consequently, it plans to vigorously defend its position, which has been confirmed by a long line of precedents and court decisions, and file all motions and appeals available to it. For more information, see note 13(i) "Tax claims and other contingencies - Provision for ongoing litigation in process related to the acquisition of a participation in Usiminas" included in the company's Consolidated Condensed Interim Financial Statements as of June 30, 2024.
In the second quarter of 2024, Ternium had a net loss of $743 million. Net of the aforementioned provision, Adjusted Net Income in the second quarter was $40 million, including a deferred tax loss for an amount of $183 million.
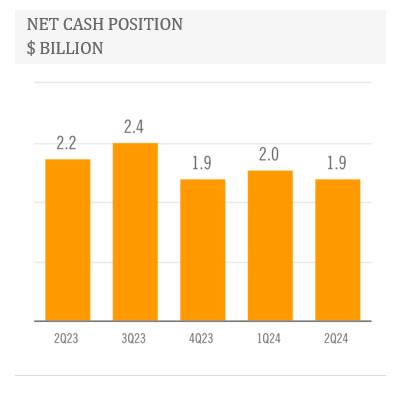
In May 2024, Ternium paid a dividend of $432 million to the company's shareholders, corresponding to the remaining of the total dividend declared for the year 2023. Capital expenditures in the period amounted to $409 million as Ternium progressed with its expansion programs in Mexico and with its new wind farm in Argentina. Despite this demanding capital allocation, net cash position as of the end of June 2024 was $1.9 billion, a slight decrease compared to net cash position of $2.0 billion as of the end of March. Strong cash provided by operating activities of $656 million and a $160 million increase in the fair value of financial instruments contributed to maintain Ternium's solid financial position as of the end of the second quarter.
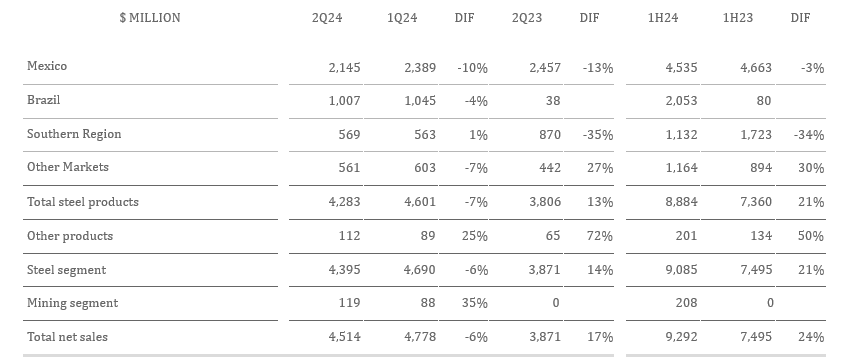
Steel shipments in the second quarter of 2024 increased in Brazil and the Southern Region. Such increases, however, were offset by a slight decrease in sales volumes in Mexico and lower shipments in Other Markets.
In Mexico, steel demand from automotive manufacturers continued growing during the second quarter, reflecting the positive momentum of this industry. On the other hand, activity in the Mexican commercial steel market was negatively affected by a downward trend in steel prices. Furthermore, customer demand in the home appliances and HVAC sectors softened in the period, reflecting a relatively sluggish construction market in North America in a context of high interest rates.
In Brazil, there was a pick-up in steel demand in the second quarter, particularly in the automotive and industrial sectors. However, imports of steel products remained high, with a significant year-over-year expansion in the first half of 2024.
In the Southern Region, steel demand in the second quarter reflected improving conditions in the Argentine market, as industrial customer demand and the commercial market showed a gradual recovery.
Outlook
Ternium expects a sequential decline in adjusted EBITDA for the third quarter of 2024, primarily attributed to reduced margins partially offset by an increase in shipments across key markets. The company anticipates a drop in realized steel prices, largely as a result of the reset of quarterly and six-months contract prices in Mexico.
The company expects consistent demand in Mexico's industrial and commercial markets, with supply chain stocks at manageable levels. The automotive industry continues to grow and the construction sector is enjoying an upswing in investment from nearshoring activities, leading to the establishment of new factories and a growing need for warehousing and logistics facilities.
In Brazil, Ternium anticipates a modest rise in shipments, supported by the automotive industry's projected growth and better activity in the construction sector. On the other hand, despite the recent establishment of a quota system to regulate steel imports in the country, imports during the second quarter remained elevated.
In Argentina, Ternium expects shipments to increase in the third quarter of 2024 after a destocking process in the second quarter, although the pace of the recovery remains uncertain.
Analysis of Second Quarter of 2024 Results
Consolidated Net Sales
Note: other products include mainly electricity sales in Mexico and Brazil.
Adjusted EBITDA
Adjusted EBITDA in the second quarter of 2024 equals Net Income adjusted to exclude:
Income Tax Results;
Net Financial Results;
Depreciation and Amortization;
Equity in Results of Non-consolidated Companies;
Provision for ongoing litigation related to the acquisition of a participation in Usiminas in 2012; and
Reversal of other Usiminas contingencies recognized as part of the PPA.
And adjusted to include the proportional EBITDA in Unigal (70% participation).
Adjusted EBITDA Margin equals Adjusted EBITDA divided by net sales. For more information see Exhibit I - Alternative performance measures - "Adjusted EBITDA".
Steel Segment
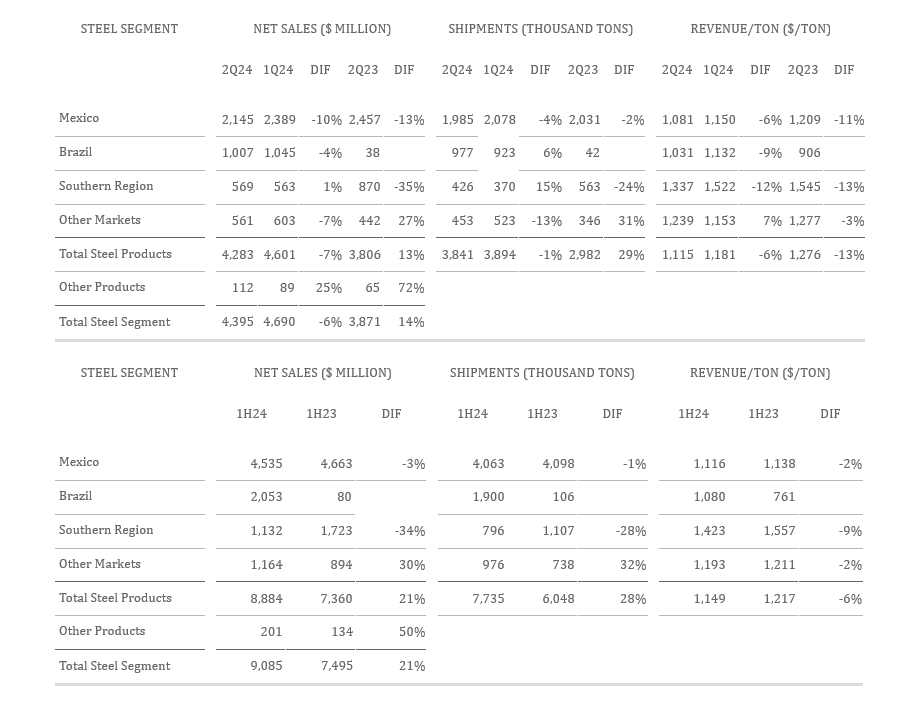
The Steel Segment net sales were down sequentially in the second quarter of 2024, mostly as a result of decreasing realized steel prices in Ternium's main steel markets. On a year-over-year basis, the consolidation of Usiminas added $1.1 billion to steel segment net sales and 1.0 million tons to steel product shipments.
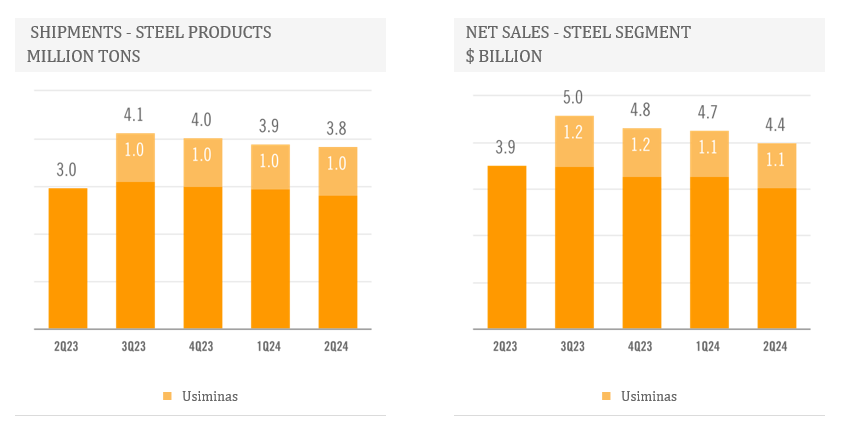
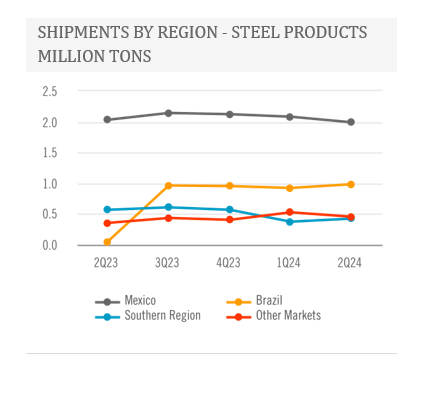
Steel products shipments in Mexico were slightly down sequentially in the second quarter, as the strength of Mexican automotive industry was offset by soft demand in the home appliances and HVAC sectors. In addition, the company's value chain was subject to disruptions caused by a tropical storm in June. Activity in Mexican commercial market remained affected by a downward trend in steel prices.
In Brazil, shipments in the second quarter reflected a widespread pick-up in steel demand. On a year-over-year basis, sales volumes increased 0.9 million tons due to the consolidation of Usiminas.
In the Southern Region, steel shipments in the quarter showed certain sequential recovery mainly as a result of a gradual improvement in the Argentine market.
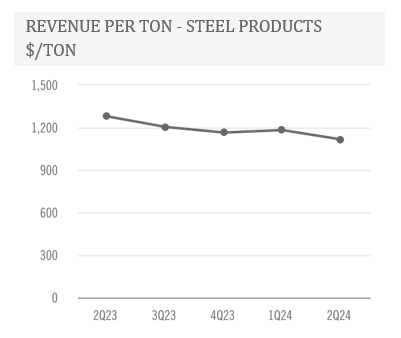
Steel revenue per ton in the second quarter of 2024 decreased sequentially and on a year-over-year basis, reflecting a weak pricing environment in Ternium's main steel markets. Particularly in North America, reference spot prices for hot-rolled flat products decreased to levels close to the lowest recorded in the last 12 months.
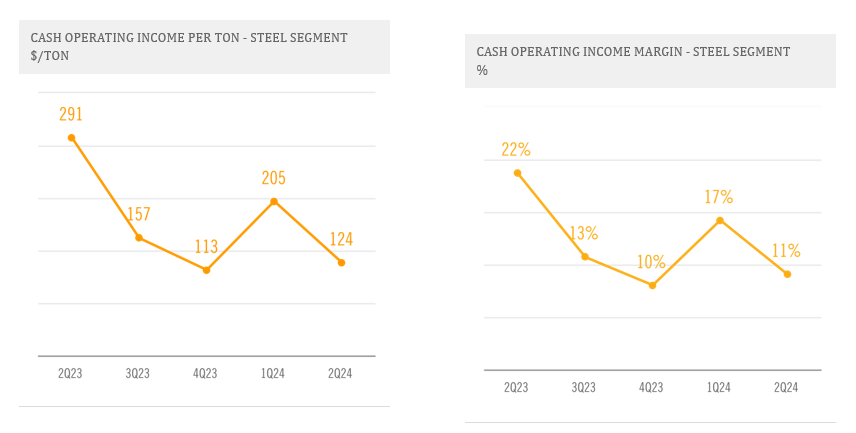
Cash Operating Income equals Operating Income adjusted to exclude depreciation and amortization as well as certain other non-cash and/or non-recurring items. The steel segment's Cash Operating Income per Ton and Margin equal the steel segment's Cash Operating Income divided by Steel Segment's Shipments and Net Sales, respectively. For more information see Exhibit I - Alternative performance measures - "Cash Operating Income - Steel Segment".
Ternium recorded sequentially lower steel segment Cash Operating Income per Ton and Margin in the second quarter of 2024. Reported ratios were negatively impacted by a decrease in realized steel prices in Ternium's main steel markets. In addition, cost per ton in the second quarter increased slightly compared to cost per ton in the prior quarter.
Mining Segment
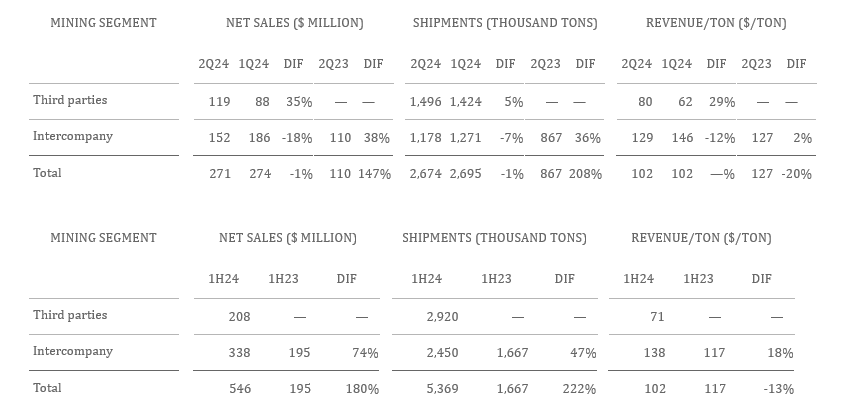
Ternium reports intercompany and third-party sales of mining products under the Mining segment. The Mining Segment net sales in the second quarter of 2024 remained relatively stable sequentially.
On a year-over-year basis, the consolidation of Usiminas added 2.0 million tons to mining products shipments in the second quarter and $161 million to net sales of mining products.
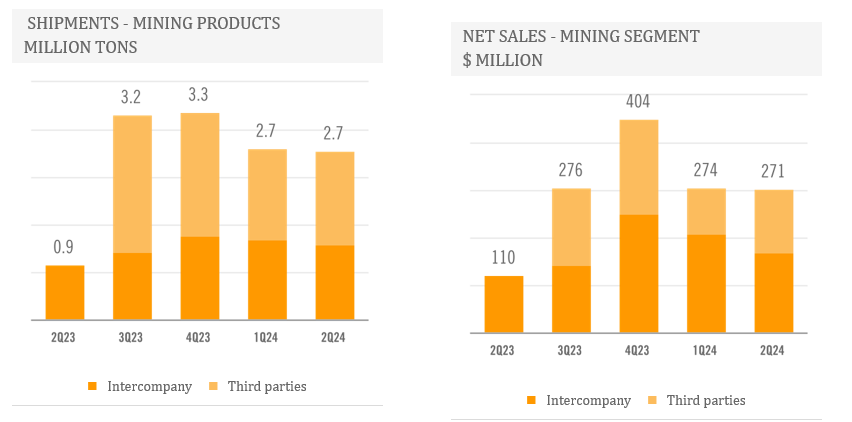
Mining revenue per ton in the second quarter of 2024 remained stable sequentially, as higher realized iron ore prices were offset by a lower participation of higher-priced pellets in the sales mix. Iron ore price volatility remained high in the first half of 2024, with reference prices reaching a 12-month peak early in January and then falling to near the lowest level recorded in the last 12 months.

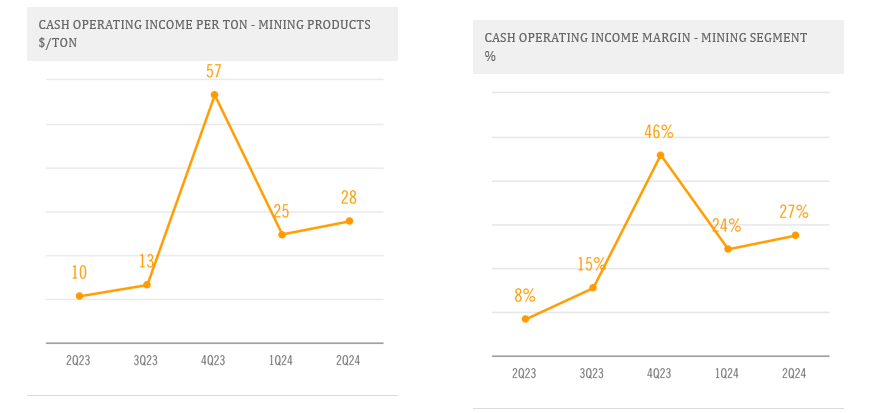
Cash Operating Income equals Operating Income adjusted to exclude depreciation and amortization as well as certain other non-cash and/or non-recurring items. The mining segment Cash Operating Income per Ton and Cash Operating Income Margin equal the mining segment's Cash Operating Income divided by its Shipments and Net Sales, respectively. For more information see Exhibit I - Alternative performance measures - "Cash Operating Income - Mining Segment".
The mining segment's Cash Operating Income per Ton and Margin increased sequentially in the second quarter of 2024, mainly as result of higher iron ore prices partially offset by a lower participation of higher-margin iron ore pellets in the sales mix.
Net Financial Results
In the second quarter of 2024, net foreign exchange results were a loss of $49 million, mainly reflecting the negative effect of the depreciation of the Brazilian Real vis-a-vis the US dollar on Usiminas' US dollar denominated debt. Usiminas uses the Brazilian Real as functional currency.
$ MILLION |
|
|
2Q24 |
|
|
|
1Q24 |
|
|
|
2Q23 |
|
|
|
1H24 |
|
|
|
1H23 |
|
|
|
|
|
|
|
|
|
|
|
|
|
|
|
|
|
|
|
|
|
|
Net interest results |
|
|
29 |
|
|
|
38 |
|
|
|
24 |
|
|
|
66 |
|
|
|
50 |
|
Net foreign exchange result |
|
|
(49 |
) |
|
|
(41 |
) |
|
|
(25 |
) |
|
|
(90 |
) |
|
|
(40 |
) |
Change in fair value of financial assets |
|
|
(5 |
) |
|
|
(137 |
) |
|
|
(14 |
) |
|
|
(142 |
) |
|
|
(10 |
) |
Other financial expense, net |
|
|
(13 |
) |
|
|
(23 |
) |
|
|
(4 |
) |
|
|
(36 |
) |
|
|
(10 |
) |
Net financial results |
|
|
(39 |
) |
|
|
(163 |
) |
|
|
(18 |
) |
|
|
(201 |
) |
|
|
(10 |
) |
Income Tax Results
Ternium Mexico, Ternium Argentina and Ternium Brasil use the US dollar as their functional currency and are, therefore, affected by deferred tax results. These results account for the impact of local currency fluctuations against the US dollar, as well as for the effect of local inflation. Effective tax rates in the second quarter and first half of 2024 included, in addition, the effect of a $783 million provision for ongoing litigation related to the acquisition of a participation in Usiminas.
$ MILLION |
|
|
2Q24 |
|
|
|
1Q24 |
|
|
|
2Q23 |
|
|
|
1H24 |
|
|
|
1H23 |
|
|
|
|
|
|
|
|
|
|
|
|
|
|
|
|
|
|
|
|
|
|
Current income tax expense |
|
|
(124 |
) |
|
|
(126 |
) |
|
|
(148 |
) |
|
|
(250 |
) |
|
|
(286 |
) |
Deferred tax (loss) gain |
|
|
(183 |
) |
|
|
86 |
|
|
|
143 |
|
|
|
(97 |
) |
|
|
361 |
|
Income tax expense |
|
|
(307 |
) |
|
|
(40 |
) |
|
|
(5 |
) |
|
|
(347 |
) |
|
|
74 |
|
Result before income tax |
|
|
(436 |
) |
|
|
532 |
|
|
|
741 |
|
|
|
96 |
|
|
|
1,141 |
|
Effective tax rate |
|
|
-70 |
% |
|
|
8 |
% |
|
|
1 |
% |
|
|
363 |
% |
|
|
-7 |
% |
|
|
|
|
|
|
|
|
|
|
|
|
|
|
|
|
|
|
|
|
|
Excluding $783 million provision for ongoing litigation related to the acquisition of a participation in Usiminas in 2012: | ||||||||||||||||||||
Result before income tax excluding provision |
|
|
347 |
|
|
|
532 |
|
|
|
741 |
|
|
|
879 |
|
|
|
1,141 |
|
Effective tax rate excluding provision |
|
|
88 |
% |
|
|
8 |
% |
|
|
1 |
% |
|
|
40 |
% |
|
|
-7 |
% |
Net Income
In the second quarter of 2024, Adjusted Net Income equaled the period's Net Loss adjusted to exclude a $783 million provision for ongoing litigation related to the acquisition of a participation in Usiminas. In the third quarter of 2023, Adjusted Net Income equaled the period's Net Loss adjusted to exclude a loss of $1.1 billion in connection with an increase in the participation in Usiminas in such quarter. Adjusted Earnings (Losses) per ADS equaled each period's Adjusted Equity Holders' Net Result divided by 1,963 million outstanding shares of Ternium's common stock, net of treasury shares, expressed in ADS equivalent (each ADS represents 10 shares).
Net Loss and Adjusted Net Income in the second quarter of 2024 included a deferred tax loss of $183 million.
$ MILLION |
|
|
2Q24 |
|
|
|
1Q24 |
|
|
|
2Q23 |
|
|
|
1H24 |
|
|
|
1H23 |
|
|
|
|
|
|
|
|
|
|
|
|
|
|
|
|
|
|
|
|
|
|
Owners of the parent |
|
|
(728 |
) |
|
|
361 |
|
|
|
627 |
|
|
|
(366 |
) |
|
|
1,001 |
|
Non-controlling interest |
|
|
(16 |
) |
|
|
130 |
|
|
|
109 |
|
|
|
114 |
|
|
|
214 |
|
Net Income (Loss) |
|
|
(743 |
) |
|
|
491 |
|
|
|
736 |
|
|
|
(252 |
) |
|
|
1,215 |
|
Excluding provision for ongoing litigation related to acquisiton of Usiminas participation |
|
|
(783 |
) |
|
|
- |
|
|
|
- |
|
|
|
(783 |
) |
|
|
- |
|
Adjusted Net Income |
|
|
40 |
|
|
|
491 |
|
|
|
736 |
|
|
|
531 |
|
|
|
1,215 |
|
Cash Flow and Liquidity
Cash from operations reached $656 million in the second quarter of 2024, including a $169 million decrease in working capital. Of note in the working capital reduction were a $117 million net decrease in trade and other receivables and a $64 million net increase in trade payables and other liabilities.
Capital expenditures amounted to $409 million in the period. Among other initiatives, Ternium made progress in the construction of new facilities in its Pesquería industrial center, where the company has recently inaugurated a new push-pull pickling line, and in the construction of a new wind farm in Argentina.
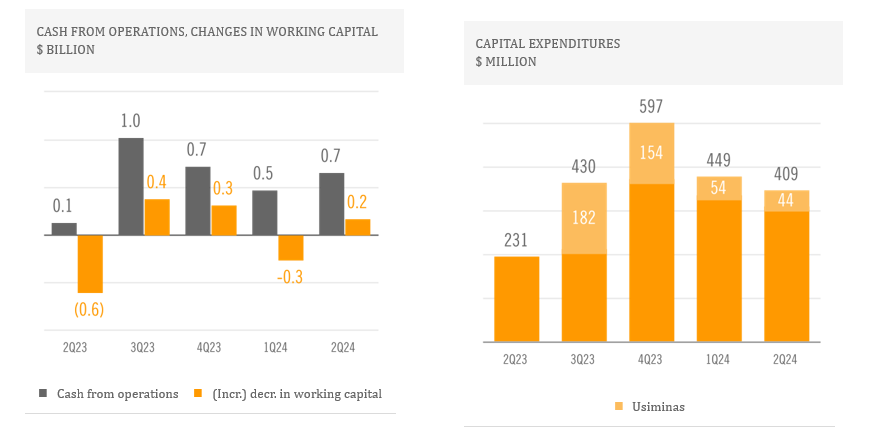
Ternium's net cash position decreased slightly in the second quarter, to $1.9 billion as of June 30, 2024.
During the period, Ternium paid a dividend to shareholders of $432 million, corresponding to the remaining of the dividend declared for the year 2023, for a total of $648 million.
In the second quarter, cash used in Ternium's capital expenditures program and for the dividend payment was largely offset mainly by cash provided by operating activities and a $160 million increase in the fair value of financial instruments.
Conference Call and Webcast
Ternium will host a conference call on July 31, 2024, at 8:30 a.m. ET in which management will discuss second quarter of 2024 results. A webcast link will be available in the Investor Center section of the company's website at www.ternium.com.
Forward Looking Statements
Some of the statements contained in this press release are "forward-looking statements". Forward-looking statements are based on management's current views and assumptions and involve known and unknown risks that could cause actual results, performance or events to differ materially from those expressed or implied by those statements. These risks include but are not limited to risks arising from uncertainties as to gross domestic product, related market demand, global production capacity, tariffs, cyclicality in the industries that purchase steel products, and other factors beyond Ternium's control.
About Ternium
Ternium is a leading steel producer in the Americas, providing advanced steel products to a wide range of manufacturing industries and the construction sector. We invest in low carbon emissions steelmaking technologies to support the energy transition and the mobility of the future. We also support the development of our communities, especially through educational programs in Latin America. More information about Ternium is available at www.ternium.com.
Income Statement
$ MILLION |
|
|
2Q24 |
|
|
1Q24 |
|
|
2Q23 |
|
|
1H24 |
|
|
1H23 |
|
|
|
|
|
|
|
|
|
|
|
|
|
|
|
|
|
|
|
|
|
|
|
|
|
|
|
|
|
|
|
|
|
|
|
Net sales |
|
|
4,514 |
|
|
4,778 |
|
|
3,871 |
|
|
9,292 |
|
|
7,495 |
|
Cost of sales |
|
|
(3,758 |
|
|
(3,675 |
|
|
(2,839 |
|
|
(7,432 |
) |
|
(5,820 |
|
Gross profit |
|
|
757 |
|
|
1,104 |
|
|
1,032 |
|
|
1,860 |
|
|
1,674 |
|
Selling, general and administrative expenses |
|
|
(435 |
) |
|
(431 |
) |
|
(304 |
) |
|
(866 |
) |
|
(597 |
) |
Other operating income |
|
|
49 |
|
|
2 |
|
|
4 |
|
|
51 |
|
|
12 |
|
Operating income |
|
|
371 |
|
|
675 |
|
|
732 |
|
|
1,045 |
|
|
1,089 |
|
|
|
|
|
|
|
|
|
|
|
|
|
|
|
|
|
|
Financial expense |
|
|
(45 |
) |
|
(45 |
) |
|
(18 |
) |
|
(90 |
) |
|
(34 |
) |
Financial income |
|
|
73 |
|
|
83 |
|
|
42 |
|
|
156 |
|
|
83 |
|
Other financial (expense) income, net |
|
|
(67 |
) |
|
(200 |
) |
|
(42 |
) |
|
(267 |
|
|
(60 |
) |
Equity in earnings of non-consolidated companies |
|
|
15 |
|
|
20 |
|
|
27 |
|
|
34 |
|
|
62 |
|
Provision for ongoing litigation related to the acquisition of a participation in Usiminas |
|
|
(783 |
) |
|
- |
|
|
- |
|
|
(783 |
) |
|
- |
|
Profit (Loss) before income tax results |
|
|
(436 |
|
|
532 |
|
|
741 |
|
|
96 |
|
|
1,141 |
|
Income tax (expense) credit |
|
|
(307 |
) |
|
(40 |
) |
|
(5 |
) |
|
(347 |
) |
|
74 |
|
Profit (Loss) for the period |
|
|
(743 |
) |
|
491 |
|
|
736 |
|
|
(252 |
) |
|
1,215 |
|
|
|
|
|
|
|
|
|
|
|
|
|
|
|
|
|
|
Attributable to: |
|
|
|
|
|
|
|
|
|
|
|
|
|
|
|
|
Owners of the parent |
|
|
(728 |
|
|
361 |
|
|
627 |
|
|
(366 |
) |
|
1,001 |
|
Non-controlling interest |
|
|
(16 |
) |
|
130 |
|
|
109 |
|
|
114 |
|
|
214 |
|
Net (Loss) Profit for the period |
|
|
(743 |
|
|
491 |
|
|
736 |
|
|
(252 |
) |
|
1,215 |
|
Statement of Financial Position
$ MILLION |
|
JUNE 30, |
|
|
DECEMBER 31, |
|
||
|
|
|
|
|
|
|||
Property, plant and equipment, net |
|
|
7,911 |
|
|
|
7,638 |
|
Intangible assets, net |
|
|
1,050 |
|
|
|
996 |
|
Investments in non-consolidated companies |
|
|
497 |
|
|
|
517 |
|
Other investments |
|
|
31 |
|
|
|
211 |
|
Deferred tax assets |
|
|
1,389 |
|
|
|
1,713 |
|
Receivables, net |
|
|
943 |
|
|
|
1,073 |
|
Total non-current assets |
|
|
11,822 |
|
|
|
12,149 |
|
|
|
|
|
|
|
|
|
|
Receivables, net |
|
|
969 |
|
|
|
1,173 |
|
Derivative financial instruments |
|
|
7 |
|
|
|
15 |
|
Inventories, net |
|
|
5,048 |
|
|
|
4,948 |
|
Trade receivables, net |
|
|
1,973 |
|
|
|
2,065 |
|
Other investments |
|
|
2,117 |
|
|
|
1,976 |
|
Cash and cash equivalents |
|
|
1,719 |
|
|
|
1,846 |
|
Total current assets |
|
|
11,833 |
|
|
|
12,024 |
|
|
|
|
|
|
|
|
|
|
Non-current assets classified as held for sale |
|
|
8 |
|
|
|
7 |
|
|
|
|
|
|
|
|
|
|
Total assets |
|
|
23,663 |
|
|
|
24,179 |
|
Statement of Financial Position (cont.)
$ MILLION |
|
JUNE 30, |
|
|
DECEMBER 31, 2023 |
|
||
|
|
|
|
|
|
|||
Capital and reserves attributable to the owners of the parent |
|
|
11,881 |
|
|
|
12,419 |
|
Non-controlling interest |
|
|
4,274 |
|
|
|
4,393 |
|
Total equity |
|
|
16,155 |
|
|
|
16,812 |
|
|
|
|
|
|
|
|
|
|
Provisions |
|
|
637 |
|
|
|
840 |
|
Deferred tax liabilities |
|
|
30 |
|
|
|
171 |
|
Other liabilities |
|
|
1,102 |
|
|
|
1,149 |
|
Trade payables |
|
|
6 |
|
|
|
12 |
|
Lease liabilities |
|
|
177 |
|
|
|
189 |
|
Borrowings |
|
|
1,232 |
|
|
|
1,206 |
|
Total non-current liabilities |
|
|
3,183 |
|
|
|
3,567 |
|
|
|
|
|
|
|
|
|
|
Provision for ongoing litigation related to the acquisition of a participation in Usiminas |
|
|
783 |
|
|
|
- |
|
Current income tax liabilities |
|
|
38 |
|
|
|
137 |
|
Other liabilities |
|
|
444 |
|
|
|
430 |
|
Trade payables |
|
|
2,250 |
|
|
|
2,233 |
|
Derivative financial instruments |
|
|
7 |
|
|
|
8 |
|
Lease liabilities |
|
|
50 |
|
|
|
52 |
|
Borrowings |
|
|
752 |
|
|
|
940 |
|
Total current liabilities |
|
|
4,324 |
|
|
|
3,801 |
|
|
|
|
|
|
|
|
|
|
Total liabilities |
|
|
7,508 |
|
|
|
7,367 |
|
|
|
|
|
|
|
|
|
|
Total equity and liabilities |
|
|
23,663 |
|
|
|
24,179 |
|
Statement of Cash Flows
$ MILLION |
|
2Q24 |
|
|
1Q24 |
|
|
2Q23 |
|
|
1H24 |
|
|
1H23 |
|
|
|
|
|
|
|
|
|
|
|
|
|
|
|
|
|
Result for the period |
|
(743 |
) |
|
491 |
|
|
736 |
|
|
(252 |
) |
|
1,215 |
|
|
|
|
|
|
|
|
|
|
|
|
|
|
|
|
|
Adjustments for: |
|
|
|
|
|
|
|
|
|
|
|
|
|
|
|
Depreciation and amortization |
|
199 |
|
|
171 |
|
|
151 |
|
|
370 |
|
|
301 |
|
Income tax accruals less payments |
|
283 |
|
|
(13 |
) |
|
(117 |
) |
|
271 |
|
|
(273 |
) |
Equity in earnings of non-consolidated companies |
|
(15 |
) |
|
(20 |
) |
|
(27 |
) |
|
(34 |
) |
|
(62 |
) |
Provision for ongoing litigation related to the acquisition of a participation in Usiminas |
|
783 |
|
|
- |
|
|
- |
|
|
783 |
|
|
- |
|
Interest accruals less payments/receipts, net |
|
(11 |
) |
|
(2 |
) |
|
6 |
|
|
(12 |
) |
|
(12 |
) |
Changes in provisions |
|
(62 |
) |
|
(7 |
) |
|
1 |
|
|
(69 |
) |
|
- |
|
Changes in working capital |
|
169 |
|
|
(266 |
|
|
(605 |
) |
|
(97 |
) |
|
(387 |
) |
Net foreign exchange results and others |
|
52 |
|
|
120 |
|
|
(18 |
) |
|
172 |
|
|
(19 |
) |
Net cash provided by operating activities |
|
656 |
|
|
475 |
|
|
127 |
|
|
1,132 |
|
|
763 |
|
|
|
|
|
|
|
|
|
|
|
|
|
|
|
|
|
Capital expenditures and advances to suppliers for PP&E |
|
(409 |
|
|
(449 |
) |
|
(231 |
) |
|
(858 |
|
|
(434 |
) |
Decrease (increase) in other investments |
|
329 |
|
|
- |
|
|
173 |
|
|
329 |
|
|
(513 |
) |
Proceeds from the sale of property, plant & equipment |
|
1 |
|
|
1 |
|
|
- |
|
|
1 |
|
|
1 |
|
Dividends received from non-consolidated companies |
|
1 |
|
|
1 |
|
|
15 |
|
|
2 |
|
|
15 |
|
Net cash used in investing activities |
|
(79 |
) |
|
(447 |
) |
|
(42 |
) |
|
(526 |
) |
|
(931 |
) |
|
|
|
|
|
|
|
|
|
|
|
|
|
|
|
|
Dividends paid in cash to company's shareholders |
|
(432 |
) |
|
- |
|
|
(353 |
) |
|
(432 |
) |
|
(353 |
) |
Dividends paid in cash to non-controlling interest |
|
(46 |
) |
|
- |
|
|
- |
|
|
(46 |
) |
|
- |
|
Finance lease payments |
|
(15 |
) |
|
(18 |
) |
|
(13 |
) |
|
(33 |
) |
|
(27 |
) |
Proceeds from borrowings |
|
303 |
|
|
131 |
|
|
27 |
|
|
434 |
|
|
73 |
|
Repayments of borrowings |
|
(365 |
) |
|
(166 |
) |
|
(31 |
) |
|
(531 |
) |
|
(227 |
) |
Net cash used in financing activities |
|
(556 |
) |
|
(53 |
) |
|
(371 |
) |
|
(608 |
) |
|
(535 |
) |
|
|
|
|
|
|
|
|
|
|
|
|
|
|
|
|
Increase (Decrease) in cash and cash equivalents |
|
22 |
|
|
(24 |
) |
|
(286 |
) |
|
(2 |
) |
|
(703 |
) |
Exhibit I - Alternative performance measures
These non-IFRS measures should not be considered in isolation of, or as a substitute for, measures of performance prepared in accordance with IFRS. These non-IFRS measures do not have a standardized meaning under IFRS and, therefore, may not correspond to similar non-IFRS financial measures reported by other companies.
Adjusted EBITDA
$ MILLION |
|
2Q24 |
|
|
1Q24 |
|
|
2Q23 |
|
|
1H24 |
|
|
1H23 |
|
|
|
|
|
|
|
|
|
|
|
|
|
|
|
|
|
Net result |
|
(743 |
) |
|
491 |
|
|
736 |
|
|
(252 |
) |
|
1,215 |
|
Adjusted to exclude: |
|
|
|
|
|
|
|
|
|
|
|
|
|
|
|
Depreciation and amortization |
|
199 |
|
|
171 |
|
|
151 |
|
|
370 |
|
|
301 |
|
Income tax results |
|
307 |
|
|
40 |
|
|
5 |
|
|
347 |
|
|
(74 |
) |
Net financial result |
|
39 |
|
|
163 |
|
|
18 |
|
|
201 |
|
|
10 |
|
Equity in earnings of non-consolidated companies |
|
(15 |
) |
|
(20 |
) |
|
(27 |
) |
|
(34 |
) |
|
(62 |
) |
Provision for ongoing litigation related to the acquisition of a participation in Usiminas |
|
783 |
|
|
- |
|
|
- |
|
|
783 |
|
|
- |
|
Reversal of other Usiminas contingencies recognized as part of the PPA |
|
(34 |
) |
|
- |
|
|
- |
|
|
(34 |
) |
|
- |
|
Adjusted to include: |
|
|
|
|
|
|
|
|
|
|
|
|
|
|
|
Proportional EBITDA in Unigal (70% participation) |
|
9 |
|
|
9 |
|
|
- |
|
|
18 |
|
|
- |
|
Adjusted EBITDA |
|
545 |
|
|
855 |
|
|
883 |
|
|
1,400 |
|
|
1,391 |
|
Divided by: net sales |
|
4,514 |
|
|
4,778 |
|
|
3,871 |
|
|
9,292 |
|
|
7,495 |
|
Adjusted EBITDA Margin (%) |
|
12 |
% |
|
18 |
% |
|
23 |
% |
|
15 |
% |
|
19 |
% |
Exhibit I - Alternative performance measures (cont.)
Cash Operating Income - Steel Segment
$ MILLION |
|
|
2Q24 |
|
|
1Q24 |
|
|
2Q23 |
|
|
1H24 |
|
|
1H23 |
|
|
|
|
|
|
|
|
|
|
|
|
|
|
|
|
|
|
Operating Income - Management View (Note "Segment Information" to Ternium's Financial Statements as of the corresponding dates) |
|
|
278 |
|
|
593 |
|
|
597 |
|
|
871 |
|
|
1,117 |
|
Plus/Minus differences in cost of sales (IFRS) |
|
|
88 |
|
|
59 |
|
|
144 |
|
|
147 |
|
|
5 |
|
Excluding depreciation and amortization |
|
|
134 |
|
|
137 |
|
|
126 |
|
|
271 |
|
|
253 |
|
Excluding reversal of other Usiminas contingencies |
|
|
(34 |
) |
|
- |
|
|
- |
|
|
(34 |
) |
|
- |
|
Including proportional EBITDA in Unigal (70% participation) |
|
|
9 |
|
|
9 |
|
|
- |
|
|
18 |
|
|
- |
|
Cash Operating Income |
|
|
476 |
|
|
798 |
|
|
867 |
|
|
1,274 |
|
|
1,374 |
|
Divided by steel shipments (thousand tons) |
|
|
3,841 |
|
|
3,894 |
|
|
2,982 |
|
|
7,735 |
|
|
6,048 |
|
Cash Operating Income per Ton - Steel |
|
|
124 |
|
|
205 |
|
|
291 |
|
|
165 |
|
|
227 |
|
Divided by steel net sales |
|
|
4,395 |
|
|
4,690 |
|
|
3,871 |
|
|
9,085 |
|
|
7,495 |
|
Cash Operating Income Margin - Steel (%) |
|
|
12 |
% |
|
17 |
% |
|
22 |
% |
|
14 |
% |
|
18 |
% |
Cash Operating Income - Mining Segment
$ MILLION |
|
|
2Q24 |
|
|
1Q24 |
|
|
2Q23 |
|
|
1H24 |
|
|
1H23 |
|
|
|
|
|
|
|
|
|
|
|
|
|
|
|
|
|
|
Operating Income - Management View (Note "Segment Information" to Ternium's Financial Statements as of the corresponding dates) |
|
|
(52 |
) |
|
(22 |
) |
|
(25 |
) |
|
(74 |
) |
|
(31 |
) |
Plus/minus differences in cost of sales (IFRS) |
|
|
61 |
|
|
54 |
|
|
10 |
|
|
115 |
|
|
(6 |
) |
Excluding depreciation and amortization |
|
|
65 |
|
|
34 |
|
|
25 |
|
|
99 |
|
|
49 |
|
Cash Operating Income |
|
|
74 |
|
|
66 |
|
|
9 |
|
|
140 |
|
|
12 |
|
Divided by mining shipments (thousand tons) |
|
|
2,674 |
|
|
2,695 |
|
|
867 |
|
|
5,369 |
|
|
1,667 |
|
Cash Operating Income per Ton - Mining |
|
|
28 |
|
|
25 |
|
|
10 |
|
|
26 |
|
|
7 |
|
Divided by mining net sales |
|
|
271 |
|
|
274 |
|
|
110 |
|
|
546 |
|
|
195 |
|
Cash Operating Income Margin - Mining (%) |
|
|
27 |
% |
|
24 |
% |
|
8 |
% |
|
26 |
% |
|
6 |
% |
|
|
|
|
|
|
|
|
|
|
|
|
|
|
|
|
Exhibit I - Alternative performance measures (cont.)
Adjusted Net Result
$ MILLION |
|
|
2Q24 |
|
|
|
3Q23 |
|
|
|
|
|
|
|
|
|
|
Net loss |
|
|
(743 |
) |
|
|
(783 |
) |
Excluding non-cash effects related to the increase in the participation in Usiminas |
|
|
- |
|
|
|
(1,106 |
) |
Excluding provision for ongoing litigation related to the acquisiton of a participation in Usiminas |
|
|
(783 |
) |
|
|
- |
|
Adjusted Net Result |
|
|
40 |
|
|
|
323 |
|
Adjusted Equity Holders' Net Result and Adjusted Earnings (Losses) per ADS
$ MILLION |
|
|
2Q24 |
|
|
|
3Q23 |
|
|
|
|
|
|
|
|
|
|
Equity holders' net loss |
|
|
(728 |
) |
|
|
(739 |
) |
Excluding non-cash effects related to the increase in the participation in Usiminas |
|
|
- |
|
|
|
(1,010 |
) |
Excluding provision for ongoing litigation related to the acquisiton of a participation in Usiminas |
|
|
(706 |
) |
|
|
- |
|
Adjusted Equity Holders' Net Result |
|
|
(21 |
) |
|
|
271 |
|
Divided by: outstanding shares of common stock, net of treasury shares (expressed in million of ADS equivalent) |
|
|
196 |
|
|
|
196 |
|
Adjusted Earnings (Losses) per ADS ($) |
|
|
(0.11 |
) |
|
|
1.38 |
|
Free Cash Flow
$ MILLION |
|
|
2Q24 |
|
|
1Q24 |
|
|
2Q23 |
|
|
1H24 |
|
|
1H23 |
|
|
|
|
|
|
|
|
|
|
|
|
|
|
|
|
|
|
Net cash provided by operating activities |
|
|
656 |
|
|
475 |
|
|
127 |
|
|
1,132 |
|
|
763 |
|
Excluding capital expenditures and advances to suppliers for PP&E |
|
|
(409 |
) |
|
(449 |
) |
|
(231 |
) |
|
(858 |
) |
|
(434 |
) |
Free cash flow |
|
|
248 |
|
|
26 |
|
|
(104 |
) |
|
274 |
|
|
329 |
|
Note: Free Cash Flow in the comparative quarters in 2023 has been modified due to a reclassification, moving the following amounts from interest accruals less payments to other investments: $46 million in the second quarter of 2023 and $64 million in the first half of 2023.
Exhibit I - Alternative performance measures (cont.)
Net Cash Position
$ BILLION |
|
JUN 30, 2024 |
|
|
MAR 31, 2024 |
|
|
DEC 31, 2023 |
|
|||
|
|
|
|
|
|
|
|
|
||||
Cash and cash equivalents2
|
|
|
1.7 |
|
|
|
1.8 |
|
|
|
1.8 |
|
Plus: other investments (current and non-current)2
|
|
|
2.1 |
|
|
|
2.3 |
|
|
|
2.2 |
|
Less: borrowings (current and non-current) |
|
|
(2.0 |
) |
|
|
(2.1 |
) |
|
|
(2.1 |
) |
Net cash position |
|
|
1.9 |
|
|
|
2.0 |
|
|
|
1.9 |
|
2 Ternium Argentina's consolidated position of cash and cash equivalents and other investments amounted to $1.3 billion and $1.2 billion as of June 30 and March 31, 2024, respectively, and $1.1 billion as of December 31, 2023.
Sebastián Martí
Ternium - Investor Relations
+1 (866) 890 0443
+54 (11) 4018 8389
www.ternium.com
SOURCE: Ternium S.A.
View the original press release on accesswire.com
