


Earlier this week, famous farm products company Tyson Foods, Inc. (TSN) reported its fourth-quarter results, posting declines in its top and bottom-line financials. Its sales declined 2.8% year-over-year to $13.35 billion, below analysts' estimates of $13.71 billion. Adjusted net income per share attributable to TSN came in at $0.37, down 77.3% year-over-year.
High beef prices in the United States due to a shortage of pasture lands have led to widespread import, which could translate into further margin pressures for TSN. Facing struggles, the company has also downsized its staff. On the other hand, TSN’s chicken and pork businesses grapple with excess supply issues.
Against this scenario, let’s look at the financial metrics trends of TSN to understand why it could be prudent to avoid the stock now.
Analyzing Tyson Foods Inc.'s Financial Performance Trends From 2021 to 2023
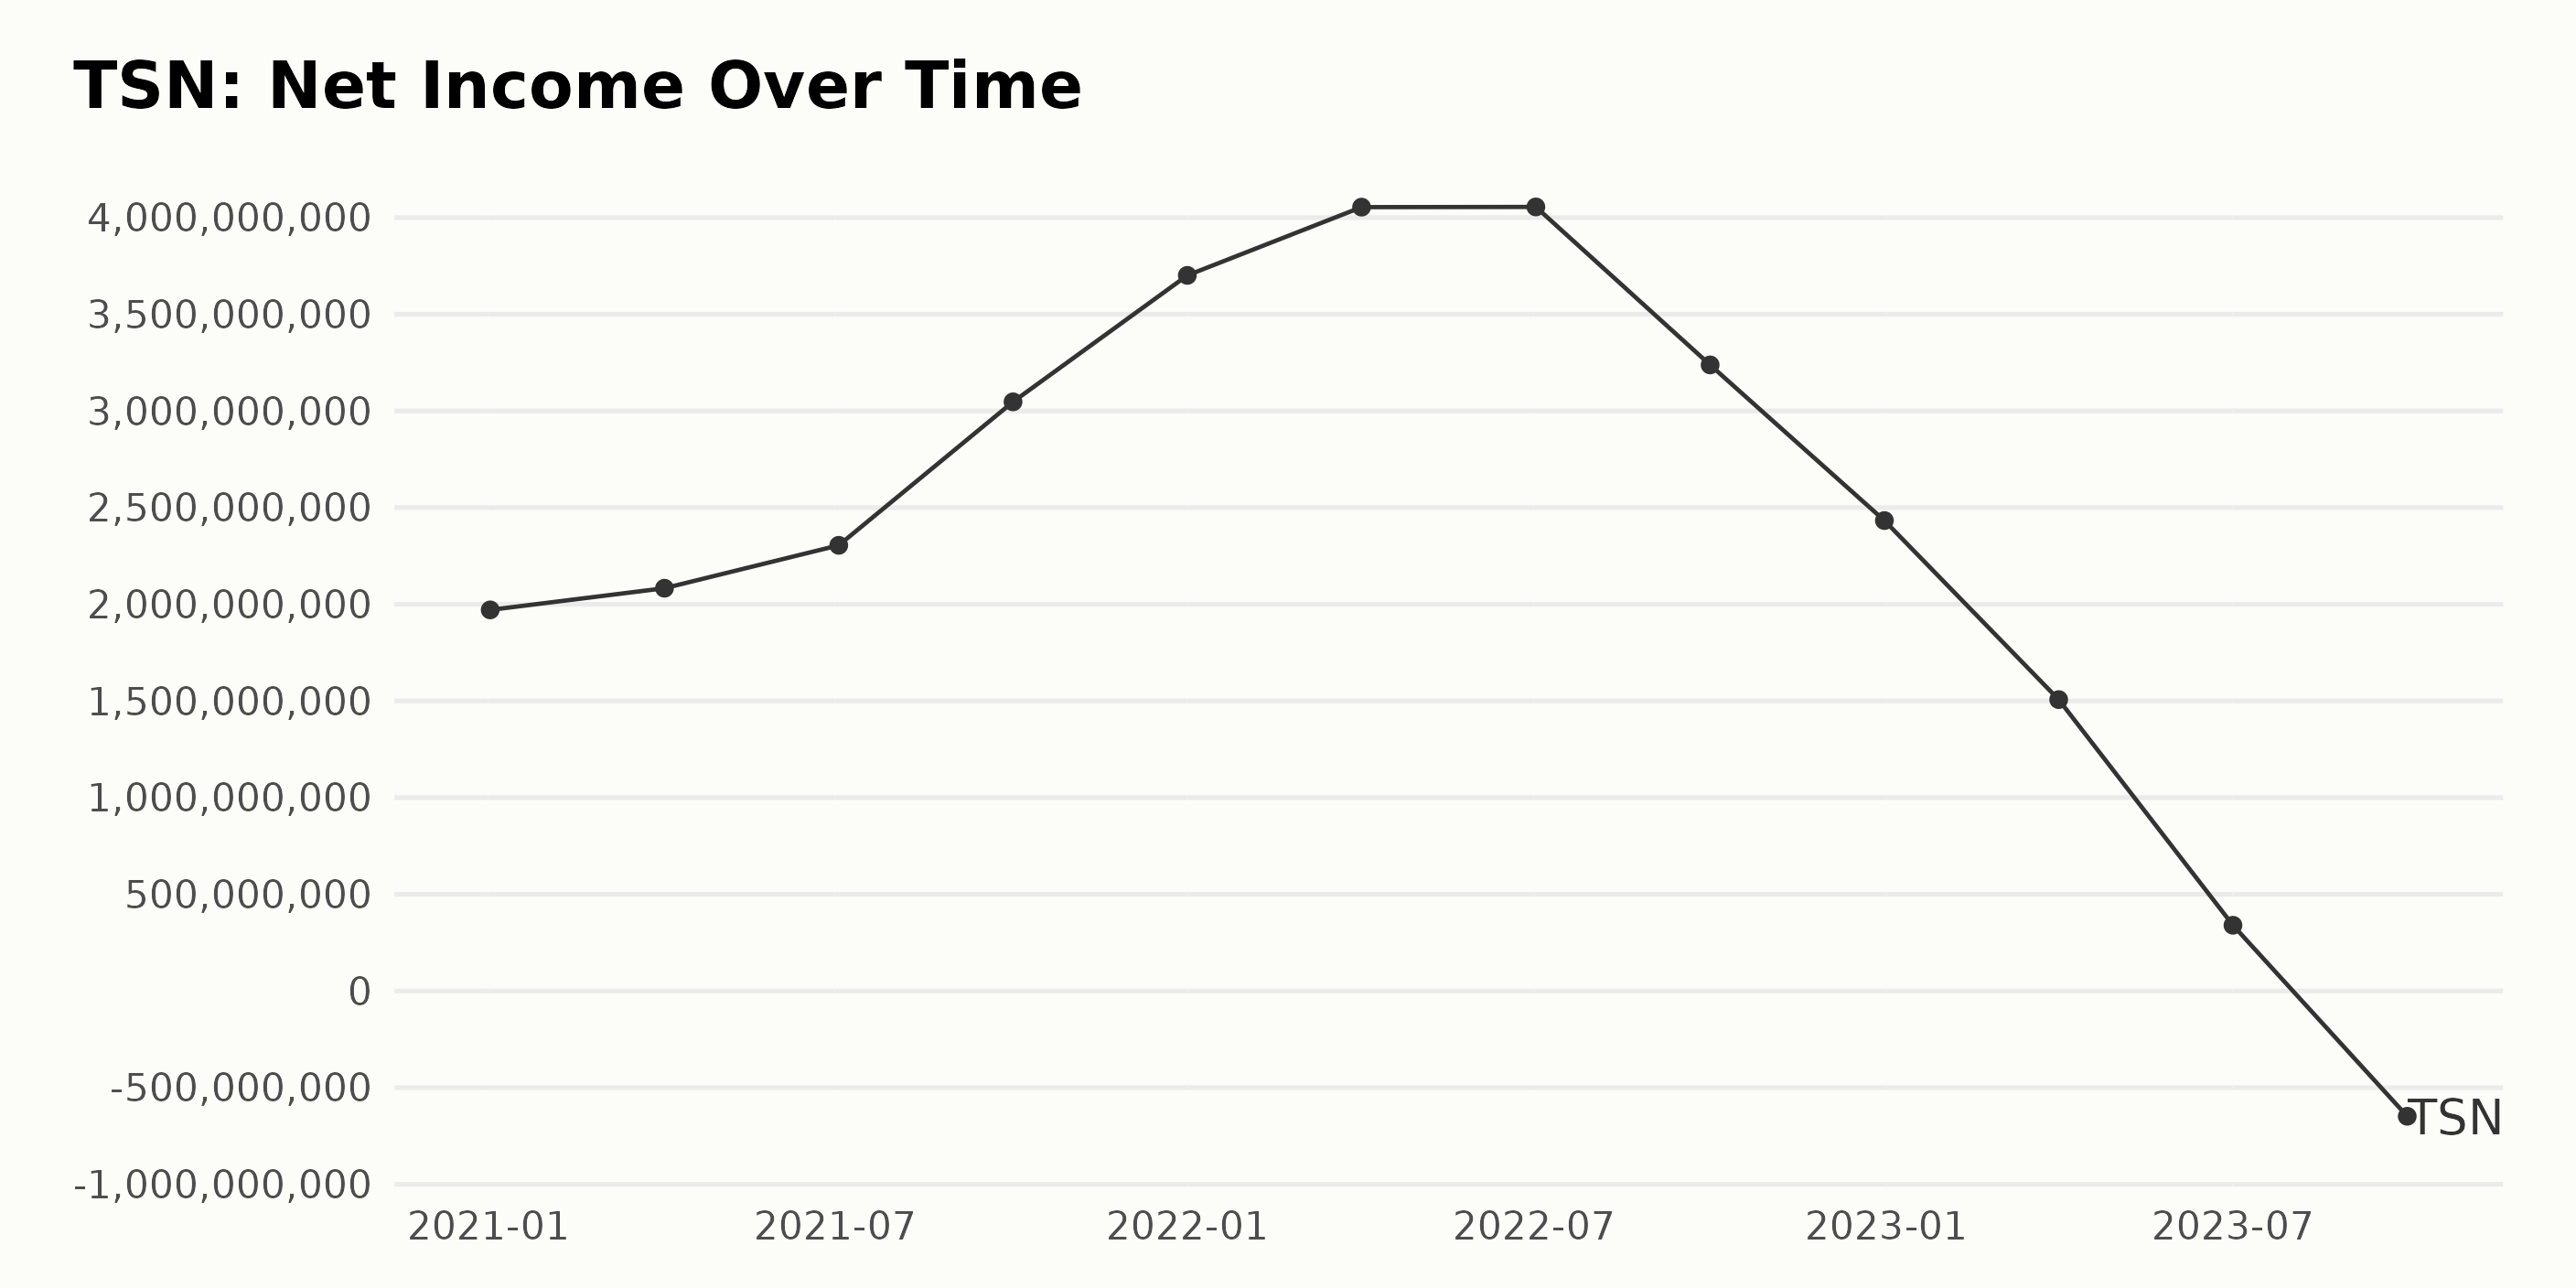
The trailing-12-month net income of TSN exhibits a fluctuating behavior according to the data series. Let's provide a summary of this trend:
- In the initial months, net income shows an evident upward trend. As of January 2, 2021, the net income stands at $1.97 billion, and it gradually increases, reaching up to $4.05 billion by July 2, 2022.
- However, there is a significant decline in net income from $4.05 billion in July 2022 to $3.24 billion in October 2022, followed by further dips reaching $2.43 billion by December 31, 2022.
- This downward trend continues into 2023, with net income plummeting to $1.5 billion by April 1, 2023, and a sharp drop is observed on July 1, 2023, with a net income of just $340 million.
- A prominent deviation is seen at the end of this series, where the net income turns negative, hitting a low of -$648 million as of September 30, 2023.
Over the entire period, from January 2, 2021, to September 30, 2023, the net income has decreased from $1.97 billion to -$648 million. Thus, the overall growth rate (measuring from the first to the last value in the series) would be negative, signaling a decrease in TSN’s net income over the study period. Please note that specific emphasis was placed on the latest data and the final value in the series when describing this trend.
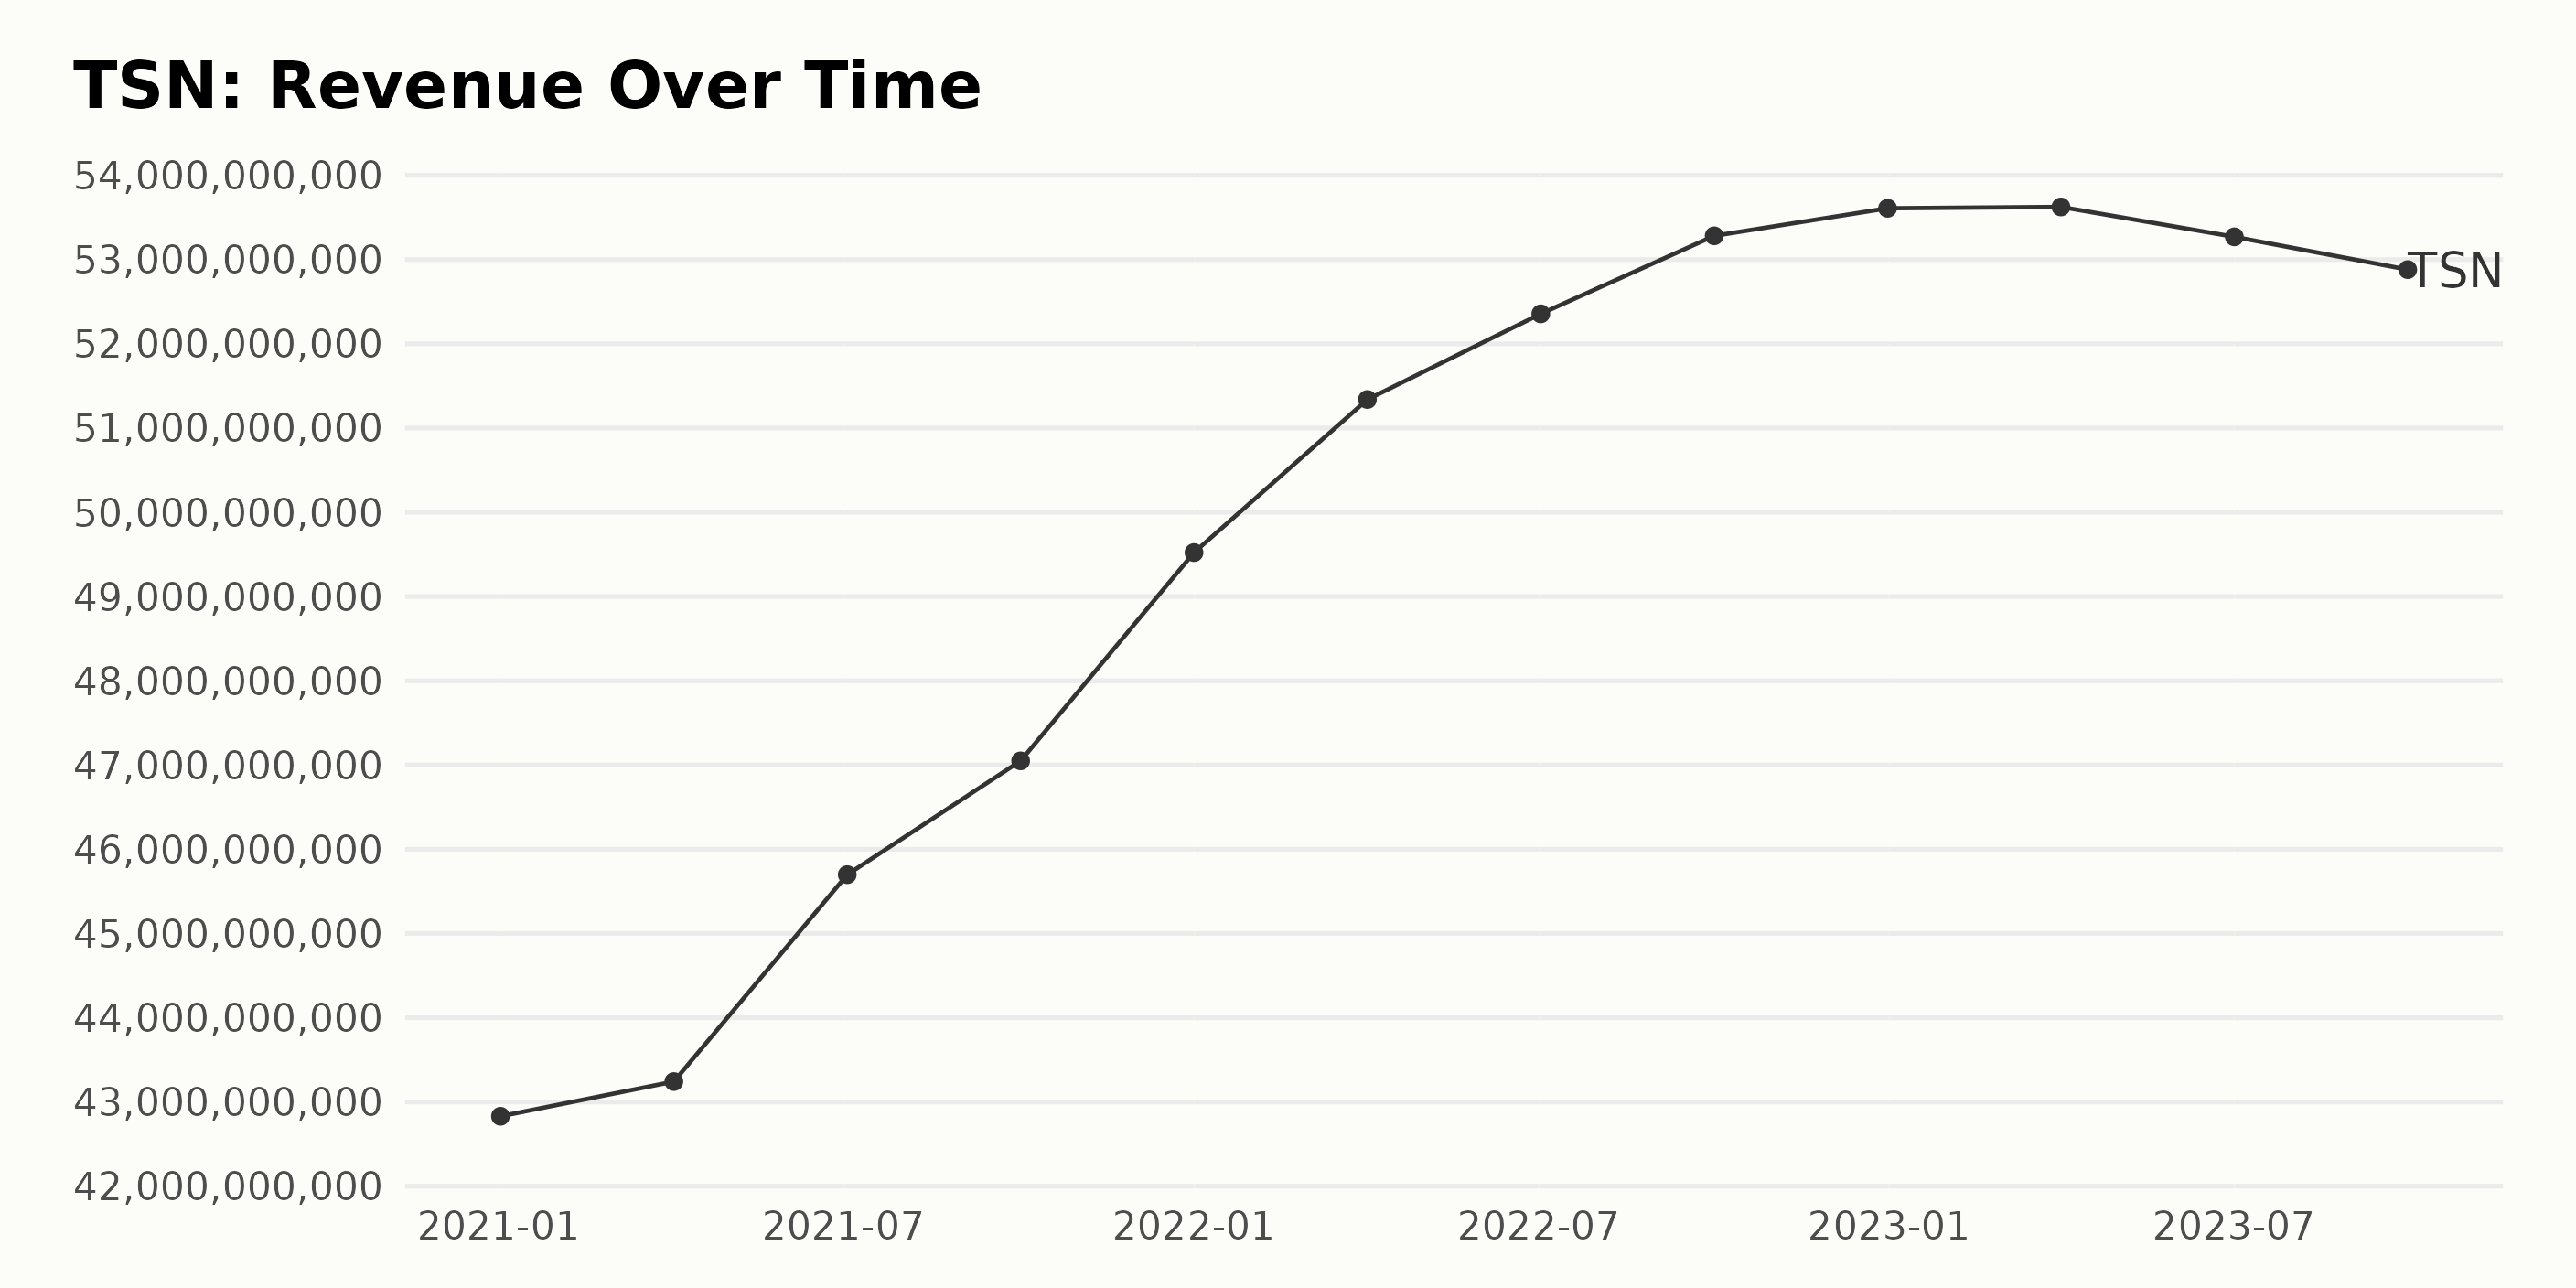
TSN exhibited a consistently increasing trailing-12-month revenue trend from 2021 to late 2022, witnessed a plateau at the beginning of 2023, and then a slight decrease towards the end of 2023. Here are some significant milestones in the company's reported revenues:
- On January 2, 2021, TSN started with a revenue of $42.83 billion.
- By April 3, 2021, TSN's revenue increased by nearly 1% to climax at $43.24 billion.
- On July 3, 2021, an appreciative leap of 5.7% raised the revenue to $45.70 billion.
- A continued upward trend was seen through October 2, 2021, reaching a revenue of $47.05 billion.
- TSN began the year 2022 with a significantly increased revenue of $49.52 billion on January 1.
- The Revenue largely surged to a new height of $51.34 billion as of April 2, 2022, denoting an annual increase rate of approximately 20%.
- The second quarter of 2022 saw another rise, clocking in at $52.36 billion by July 2.
- Ending the year strong, TSN achieved a revenue of $53.61 billion on December 31, 2022.
- Contrary to the previous upward trend, the revenue slightly plateaued at around $53.63 billion by April 1, 2023.
- An exceptional downturn was noticeable. By July 1, 2023, TSN reported a Revenue of $53.27 billion, a slight decrease from the previous quarter.
- TSN ended the series with a further decrease to $52.88 billion by September 30, 2023.
Although there were fluctuations throughout, an overall growth was observed from the first reported revenue in January 2021 ($42.83 billion) to the last in September 2023 ($52.88 billion) giving TSN a total approximate growth rate of 23.42% during this period. This indicates a strong financial performance despite minor setbacks towards the end of the analysis period.
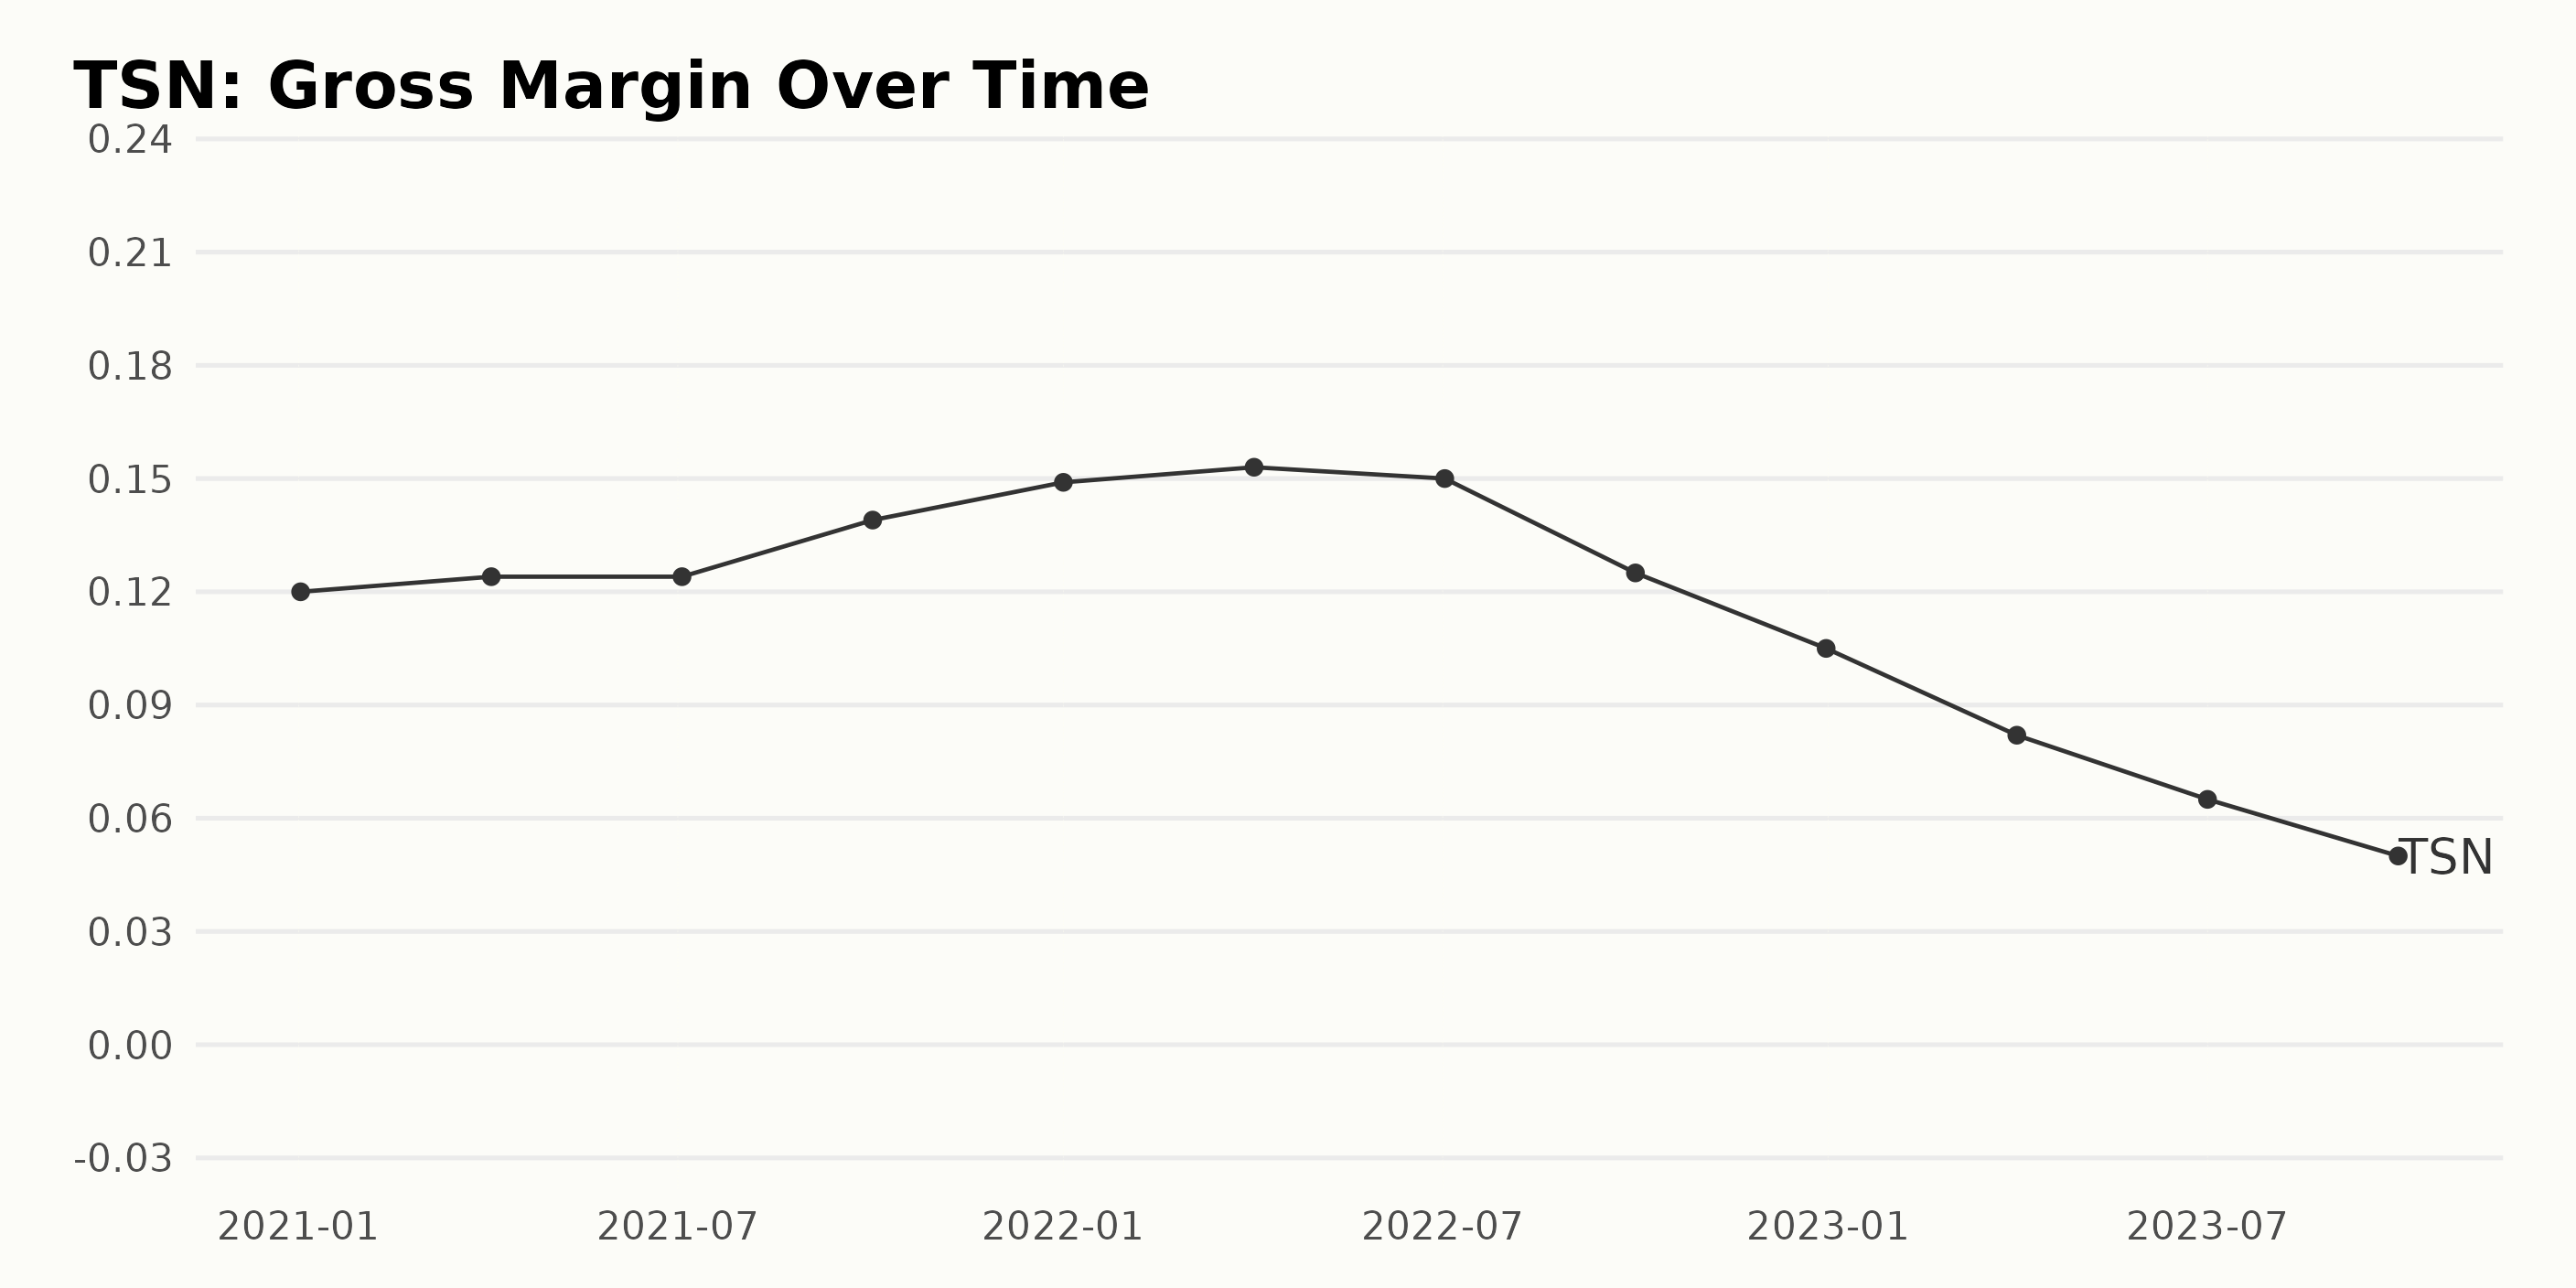
From the given series of data, TSN's gross margin appears to reflect certain variations over distinct periods:
- In the first quarter of 2021, TSN's gross margin was 12.00%. It slightly increased to 12.40% in April and remained unchanged at 12.40% in July.
- There was a significant increase in October 2021, taking the gross margin to 13.90%. The upward trend continued all the way through the beginning of 2022.
- By January 2022, the gross margin had spiked further, reaching 14.90%. Subsequently, it saw another increment in April 2022, being detailed at 15.30%.
- Later, in July 2022, there was a small drop to 15.00%, but a more significant dip occurred by October, where the gross margin plunged to 12.50%.
- Furthermore, Tyson Foods Inc. experienced a deteriorating gross margin in December 2022 at 10.50%.
- The year 2023 appears to show a consistent decrease starting from an already lower rate of 8.20% in April, and then it continues to dwindle to 6.50% in July. Eventually, the gross margin bottomed out at 5.00% by end-September.
To sum up, TSN displayed an escalating trend of its gross margin in 2021, peaking in 2022 at 15.30% until it began descending during the latter part of 2022 until 2023. Therefore, compared to the start of 2021 (12.00%), the last reported value indicates a negative growth rate of 58.33%, illustrating a significant reduction in the gross margin over the specified period.
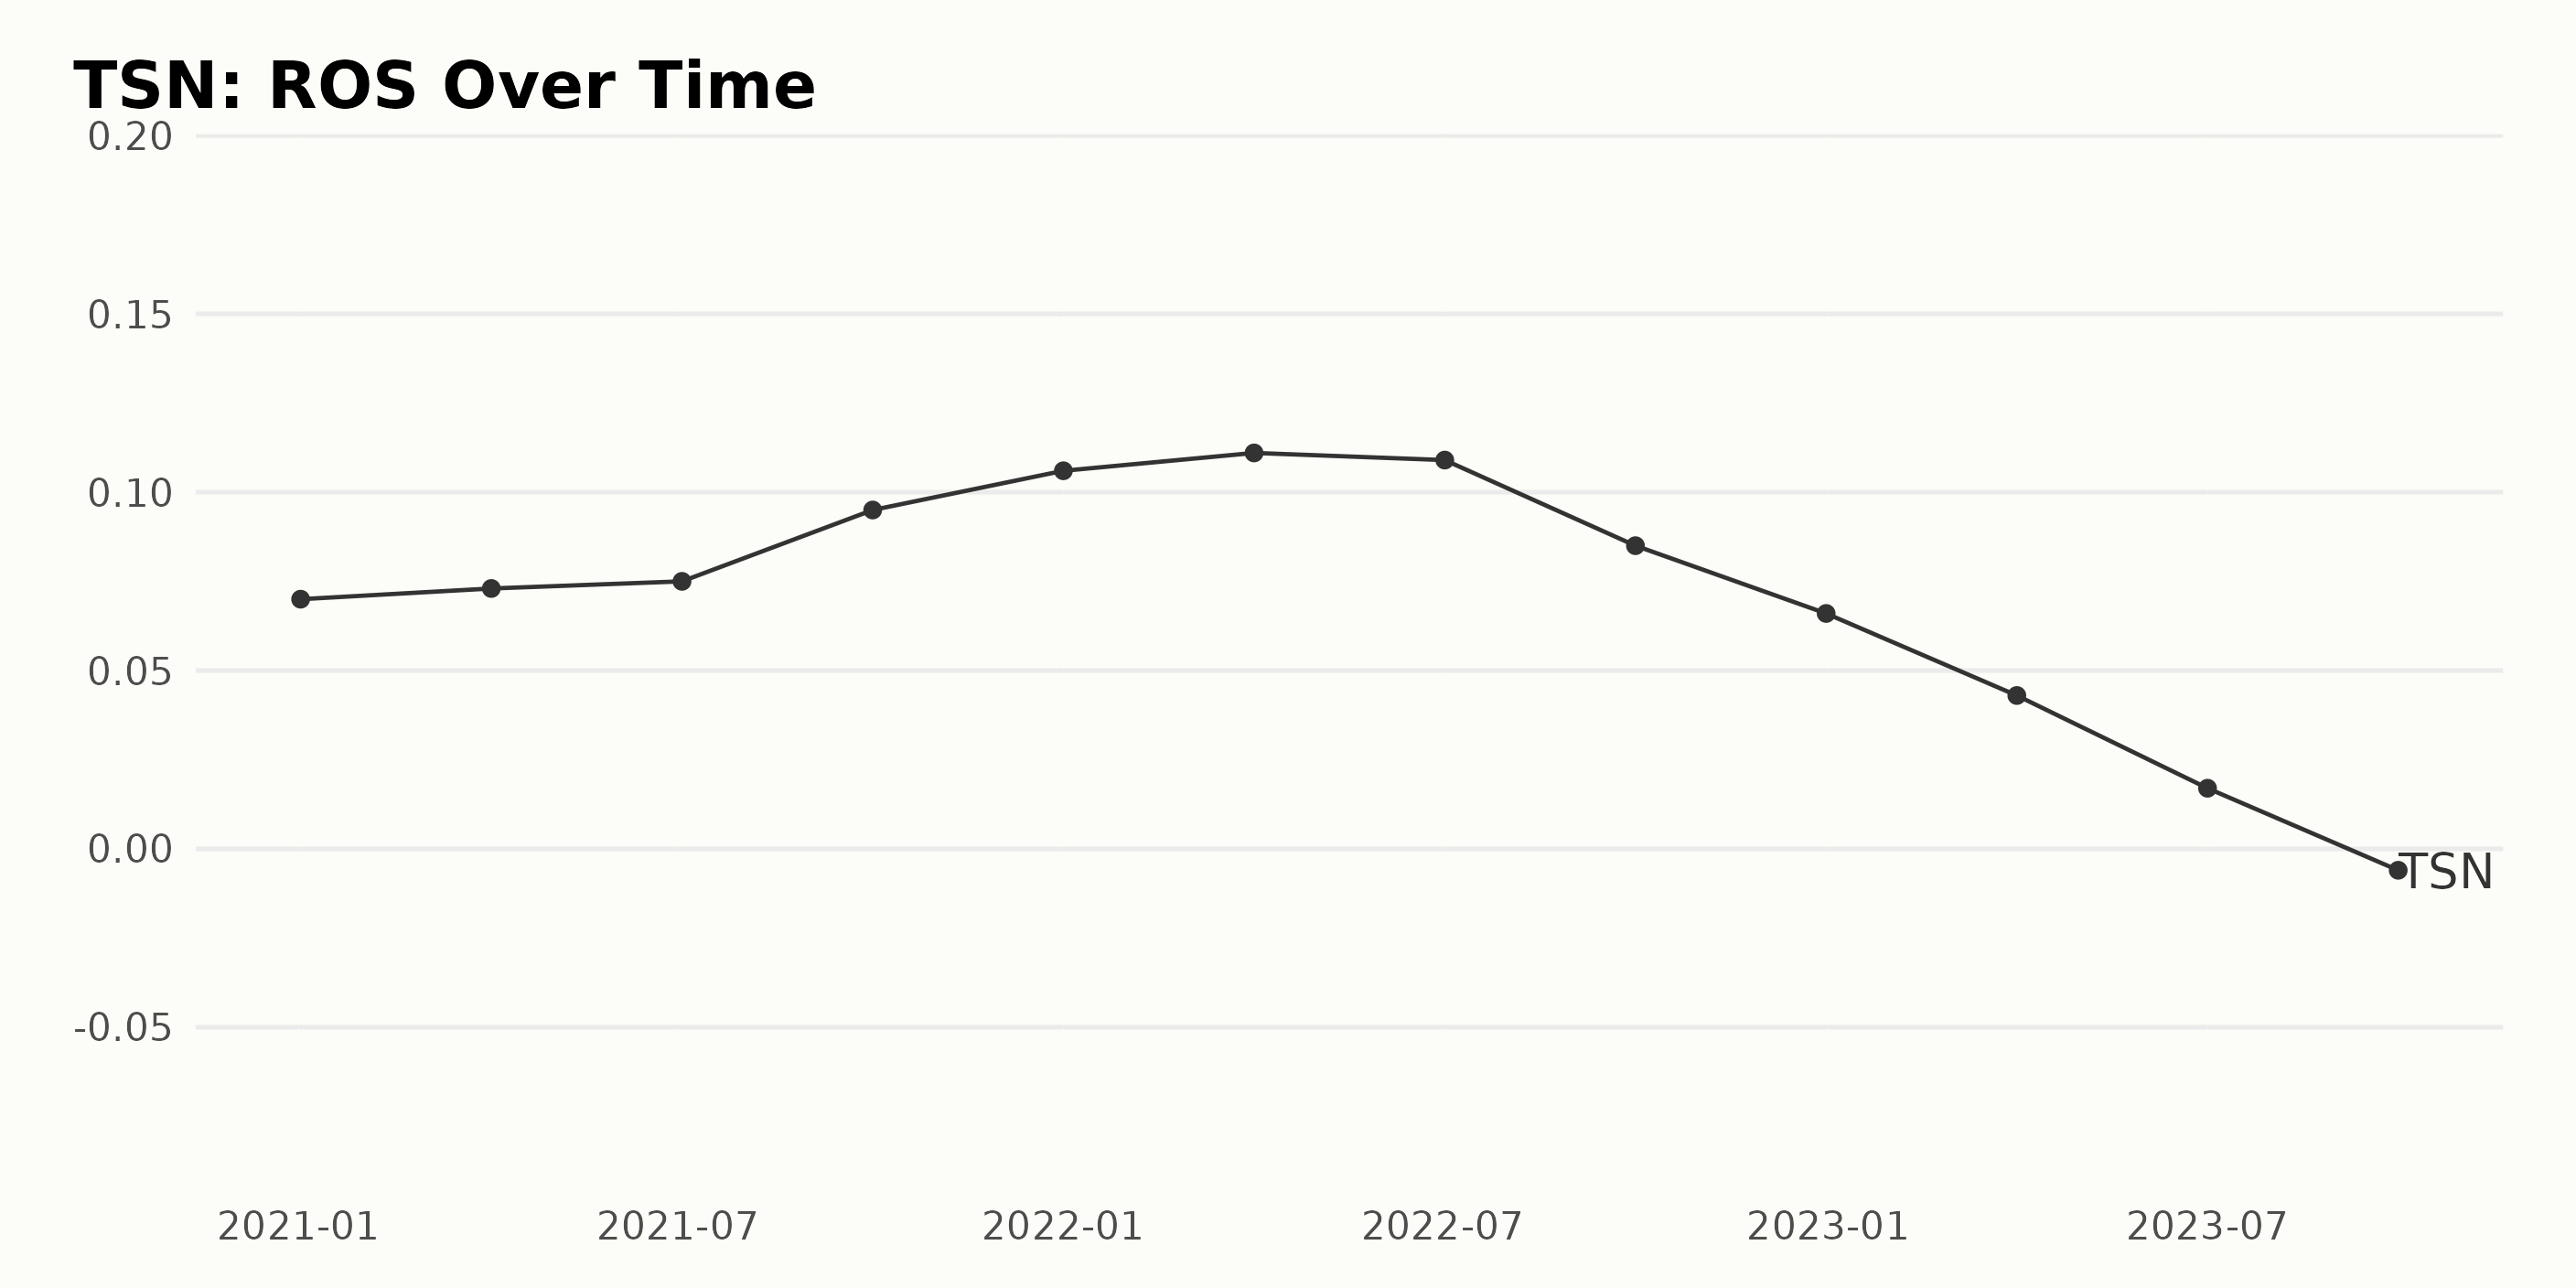
TSN’s Return On Sales (ROS) demonstrates a fluctuating trend over the tracked period.
- In January 2021, TSN's ROS stood at 0.07.
- The ROS saw incremental growth until October 2021, peaking at 0.095.
- However, there was a slight dip in ROS to 0.109 by July 2022 from 0.111 in April 2022.
- The ROS significantly declined thereafter, reaching its lowest point of -0.006 by September 2023.
A few observations can be noted:
- The most considerable growth occurred between October 2021 and January 2022, where the ROS rose from 0.095 to 0.106.
- A noticeable decline is observed from October 2022, when the ROS dropped from 0.085 to -0.006 in September 2023.
In terms of overall growth measured from the first value to the last, the ROS of TSN decreased by approximately 0.076, representing a negative growth rate. The trend, therefore, seems to be negative over the period under review, with more recent data indicating a continued downward trajectory.
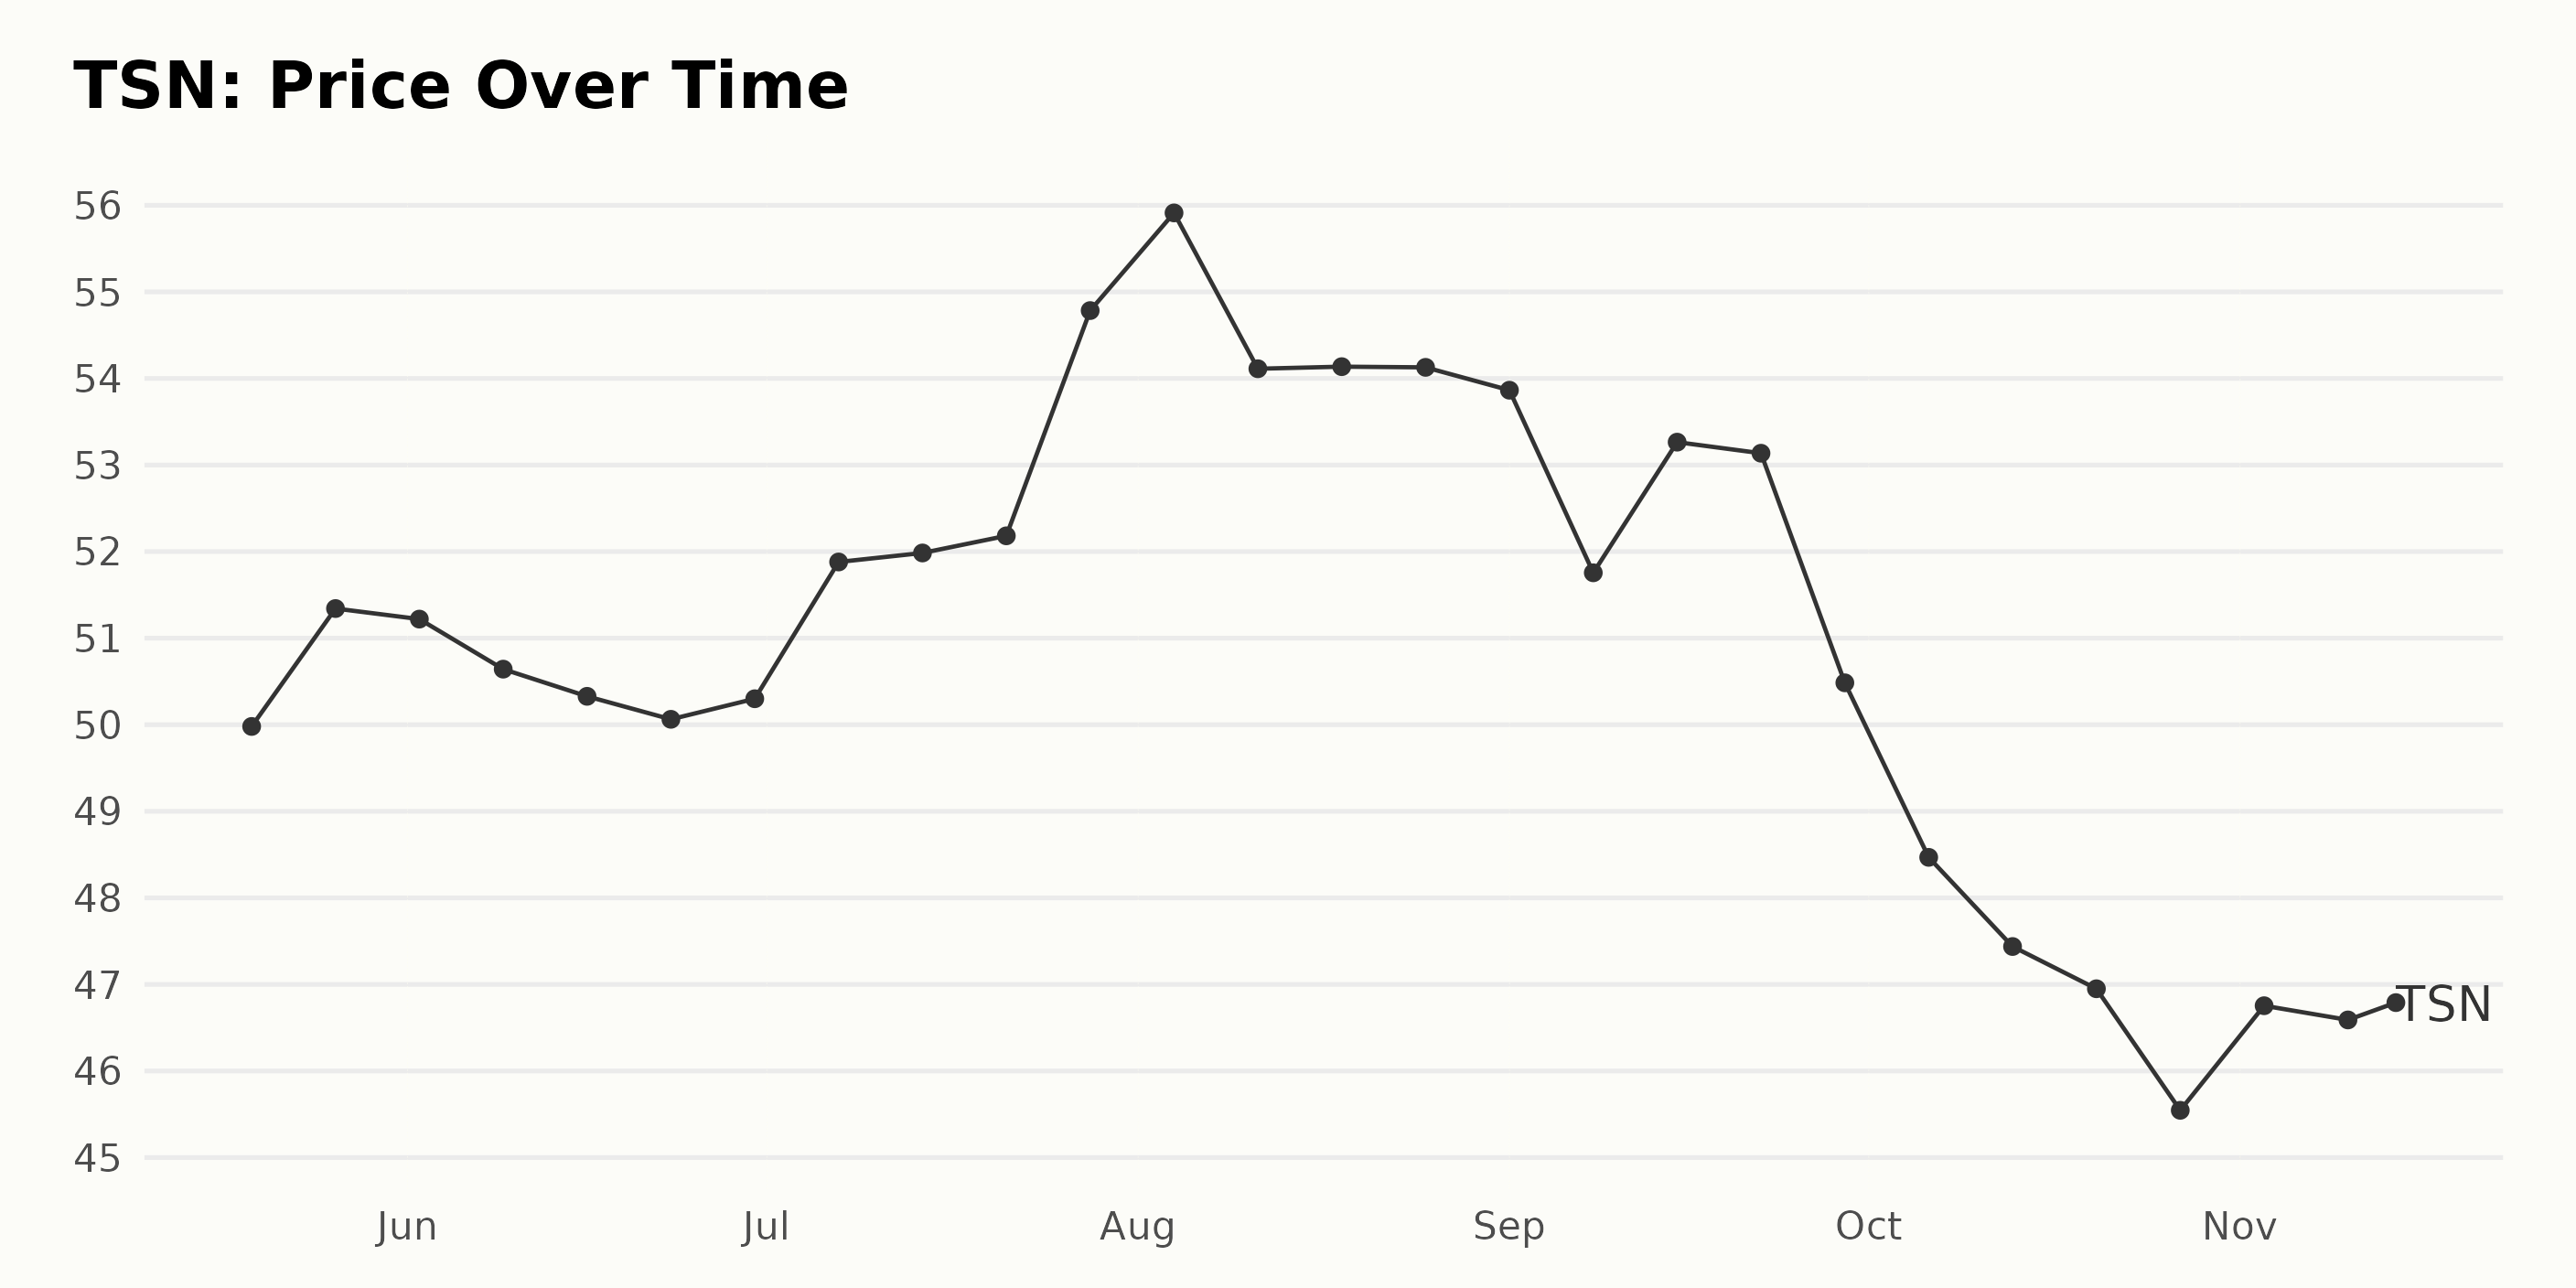
Six-Month Analysis of Tyson Foods, Inc.'s Fluctuating Share Prices (May-November 2023)
The data shows the share price trends of TSN over a six-month period from May 2023 to November 2023.
- In May 2023, the share price increased modestly from $49.98 on May 19 to $51.34 on May 26.
- The share price experienced very marginal fluctuations throughout June 2023, with the price slightly decreasing from $51.22 at the start of the month to $50.3 at the end of the month.
- The month of July 2023 witnessed an overall upward trend, beginning from $51.88 on July 7 and further increasing to a high of $54.78 by July 28, an acceleration in growth.
- Following this, in August 2023, the share price peaked at $55.91 at the start of the month and later stabilized around the mid-$54 range.
- Tyson Foods' shares experienced a downward trend in September 2023, starting at $53.86 at the start of the month and sliding down to $50.48 by the end of the month - a deceleration in price.
- The declining trend progressed into October 2023, where the price fell from $48.46 at the start to $45.54 at the end of the month.
- November 2023 saw a slight increase from the previous month with the share price rising to $47.74.
In summary, the data representing TSN's share prices from May 2023 to November 2023 reflects a growth rate that fluctuated, showing periods of both acceleration (particularly in July 2023) and deceleration (notably through September and October 2023). Here is a chart of TSN's price over the past 180 days.
Assessing Tyson Foods Stock Performance: Value, Stability, and Momentum Explained
TSN, which falls under the Food Makers category of stocks, currently holds a POWR Ratings grade of D (Sell). As of November 15, 2023, TSN came in the #66 rank among the total of 77 stocks in this category. Below is a summary of TSN's POWR grade and ranking within its category over a several-month period:
- In May 2023, TSN held a POWR grade of C (Neutral), with rankings hovering around #70 and #71.
- From June through early July 2023, TSN's POWR grade was still C (Neutral), but the stock's ranking mildly deteriorated within the category by one position each week.
- Starting mid-July 2023, the POWR grade for TSN dropped to D (Sell). Despite this downgrade, its ranking saw minor improvements until early August, rising to #70.
- In mid-September 2023, TSN had an improved rank of #68 despite maintaining a POWR grade of D (Sell). However, this rank fluctuated between #68 and #72 in subsequent weeks.
- As of mid-November 2023, TSN continues to maintain a POWR Grade of D (Sell). Its rank in the category of Food Makers is #66.
To summarize, over the specified time frame, TSN's POWR grade has downgraded from C (Neutral) to D (Sell), while its rank within its category has seen mild fluctuations ranging from #66 to #73.
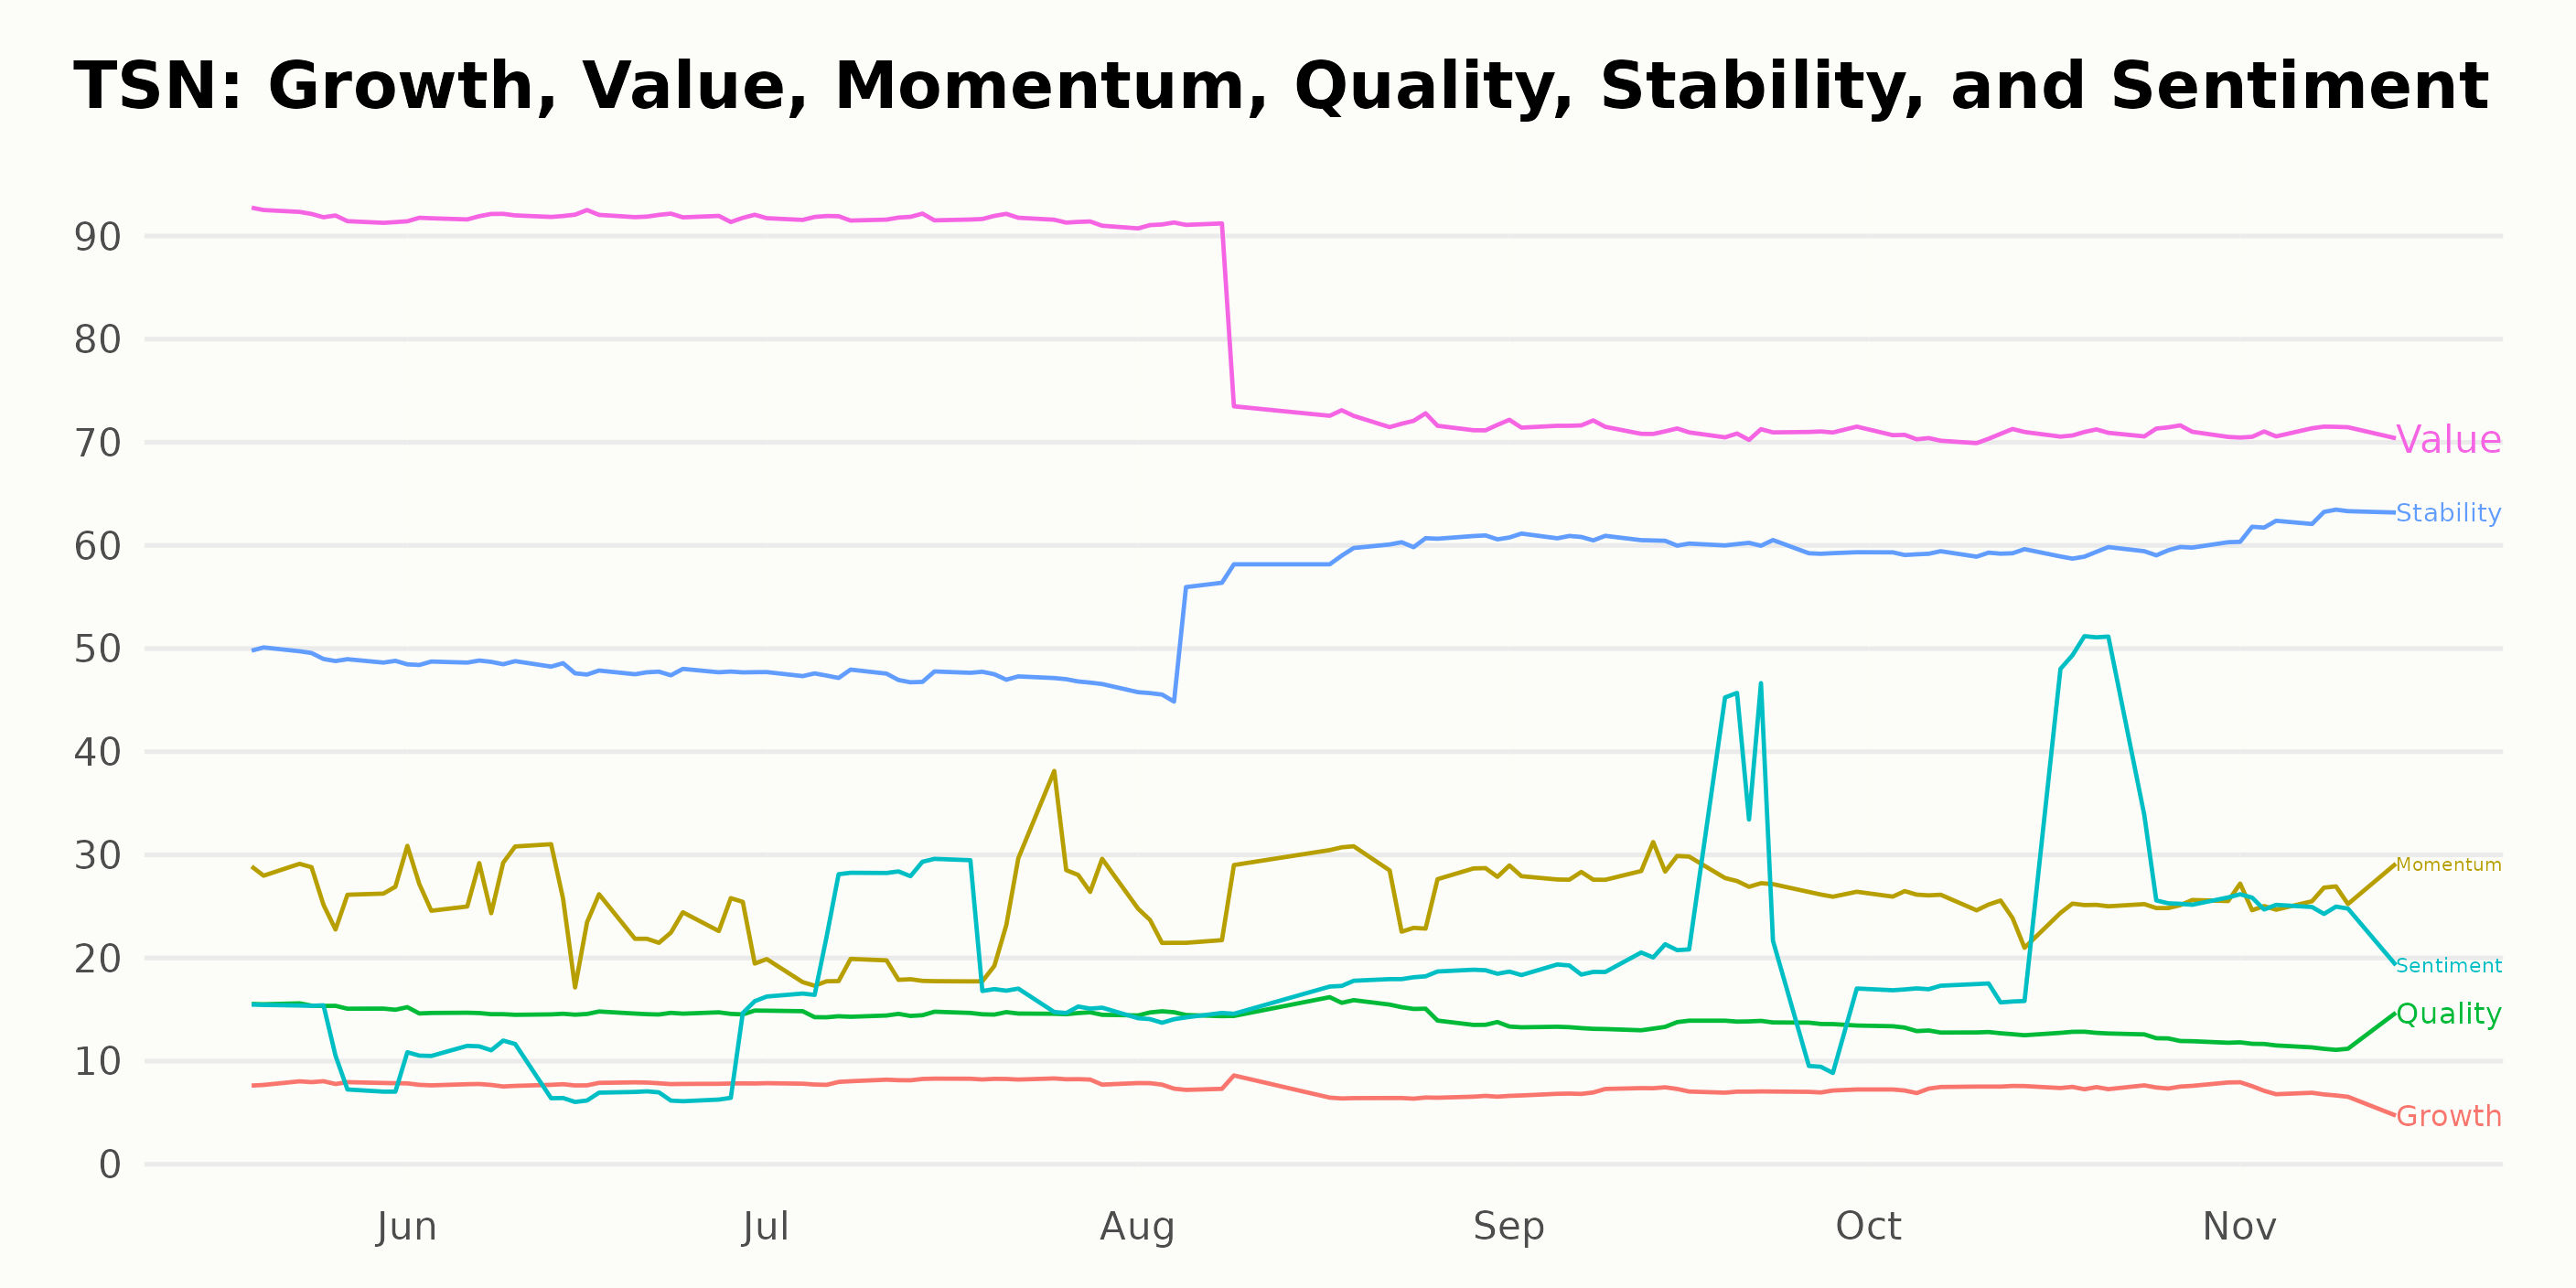
The POWR Ratings for TSN showcase variations in six dimensions. Here are the three most noteworthy dimensions:
- Value: This dimension holds the highest rating for TSN over the provided period. Specifically, the value peaked at a rating of 92 in May, June, and July of 2023. Since then, it has been slowly dropping, evidenced by the scores of 78 in August and 71 from September to November of the same year.
- Stability: It displays an interesting upward trend throughout the period. In May 2023, stability had a score of 49 but closed out on November 14, 2023, with a significantly higher value of 62.
- Momentum: This dimension fluctuated across the months but hasn't shown a stark trend like Value or Stability. For instance, it started with 27 in May 2023 and ended with a close rating of 26 in November 2023. The Momentum rating has remained largely above 20, with a dip to 22 in July 2023.
These ratings suggest that while TSN held a high value earlier in the year, its stability has steadily increased over these months, whereas the momentum remained fairly constant with minor fluctuations.
How does Tyson Foods, Inc. (TSN) Stack Up Against its Peers?
Other stocks in the Food Makers sector that may be worth considering are Lifeway Foods, Inc. (LWAY), Sysco Corporation (SYY), and Toyo Suisan Kaisha, Ltd. (TSUKY) - they have better POWR Ratings. Click here to explore more Food Makers stocks.
What To Do Next?
43 year investment veteran, Steve Reitmeister, has just released his 2024 market outlook along with trading plan and top 11 picks for the year ahead.
TSN shares rose $0.16 (+0.34%) in premarket trading Wednesday. Year-to-date, TSN has declined -21.29%, versus a 18.64% rise in the benchmark S&P 500 index during the same period.
About the Author: Anushka Dutta

Anushka is an analyst whose interest in understanding the impact of broader economic changes on financial markets motivated her to pursue a career in investment research.
The post Tyson Foods (TSN) Post-Earnings Analysis: Buy or Sell? appeared first on StockNews.com