


Several fintech stocks, beaten down last year, are soaring, primarily propelled by improving macroeconomic conditions and tempering inflationary pressures. SoFi Technologies, Inc. (SOFI) shares have registered impressive gains this year, surging 97.2% year-to-date.
However, with a beta of 1.72, the stock may continue to exhibit substantial volatility in the near term. Moreover, earlier this month, Morgan Stanley analyst Jeffrey Adelson downgraded the rating on SOFI to Underweight. According to Adelson, SOFI looks “increasingly like a bank” and should be valued like one.
While the company continues to grow with diversification in its financial products and services portfolio, there have been notable challenges. Over the past year, SOFI suffered from deteriorated loan demand as consumers became reluctant amid rising interest rates.
Although there’s growing optimism that the Federal Reserve is approaching the end of its rate-hiking cycle, rates are not expected to begin to fall anytime soon.
Given these varying dynamics, I think SOFI might not be the best stock to bank on right now. Analysis of its key metrics will provide additional insight into its prospects.
Analyzing SOFI’s Financial Performance: Reduction in Net Losses and Steady Revenue Growth from 2020-2023
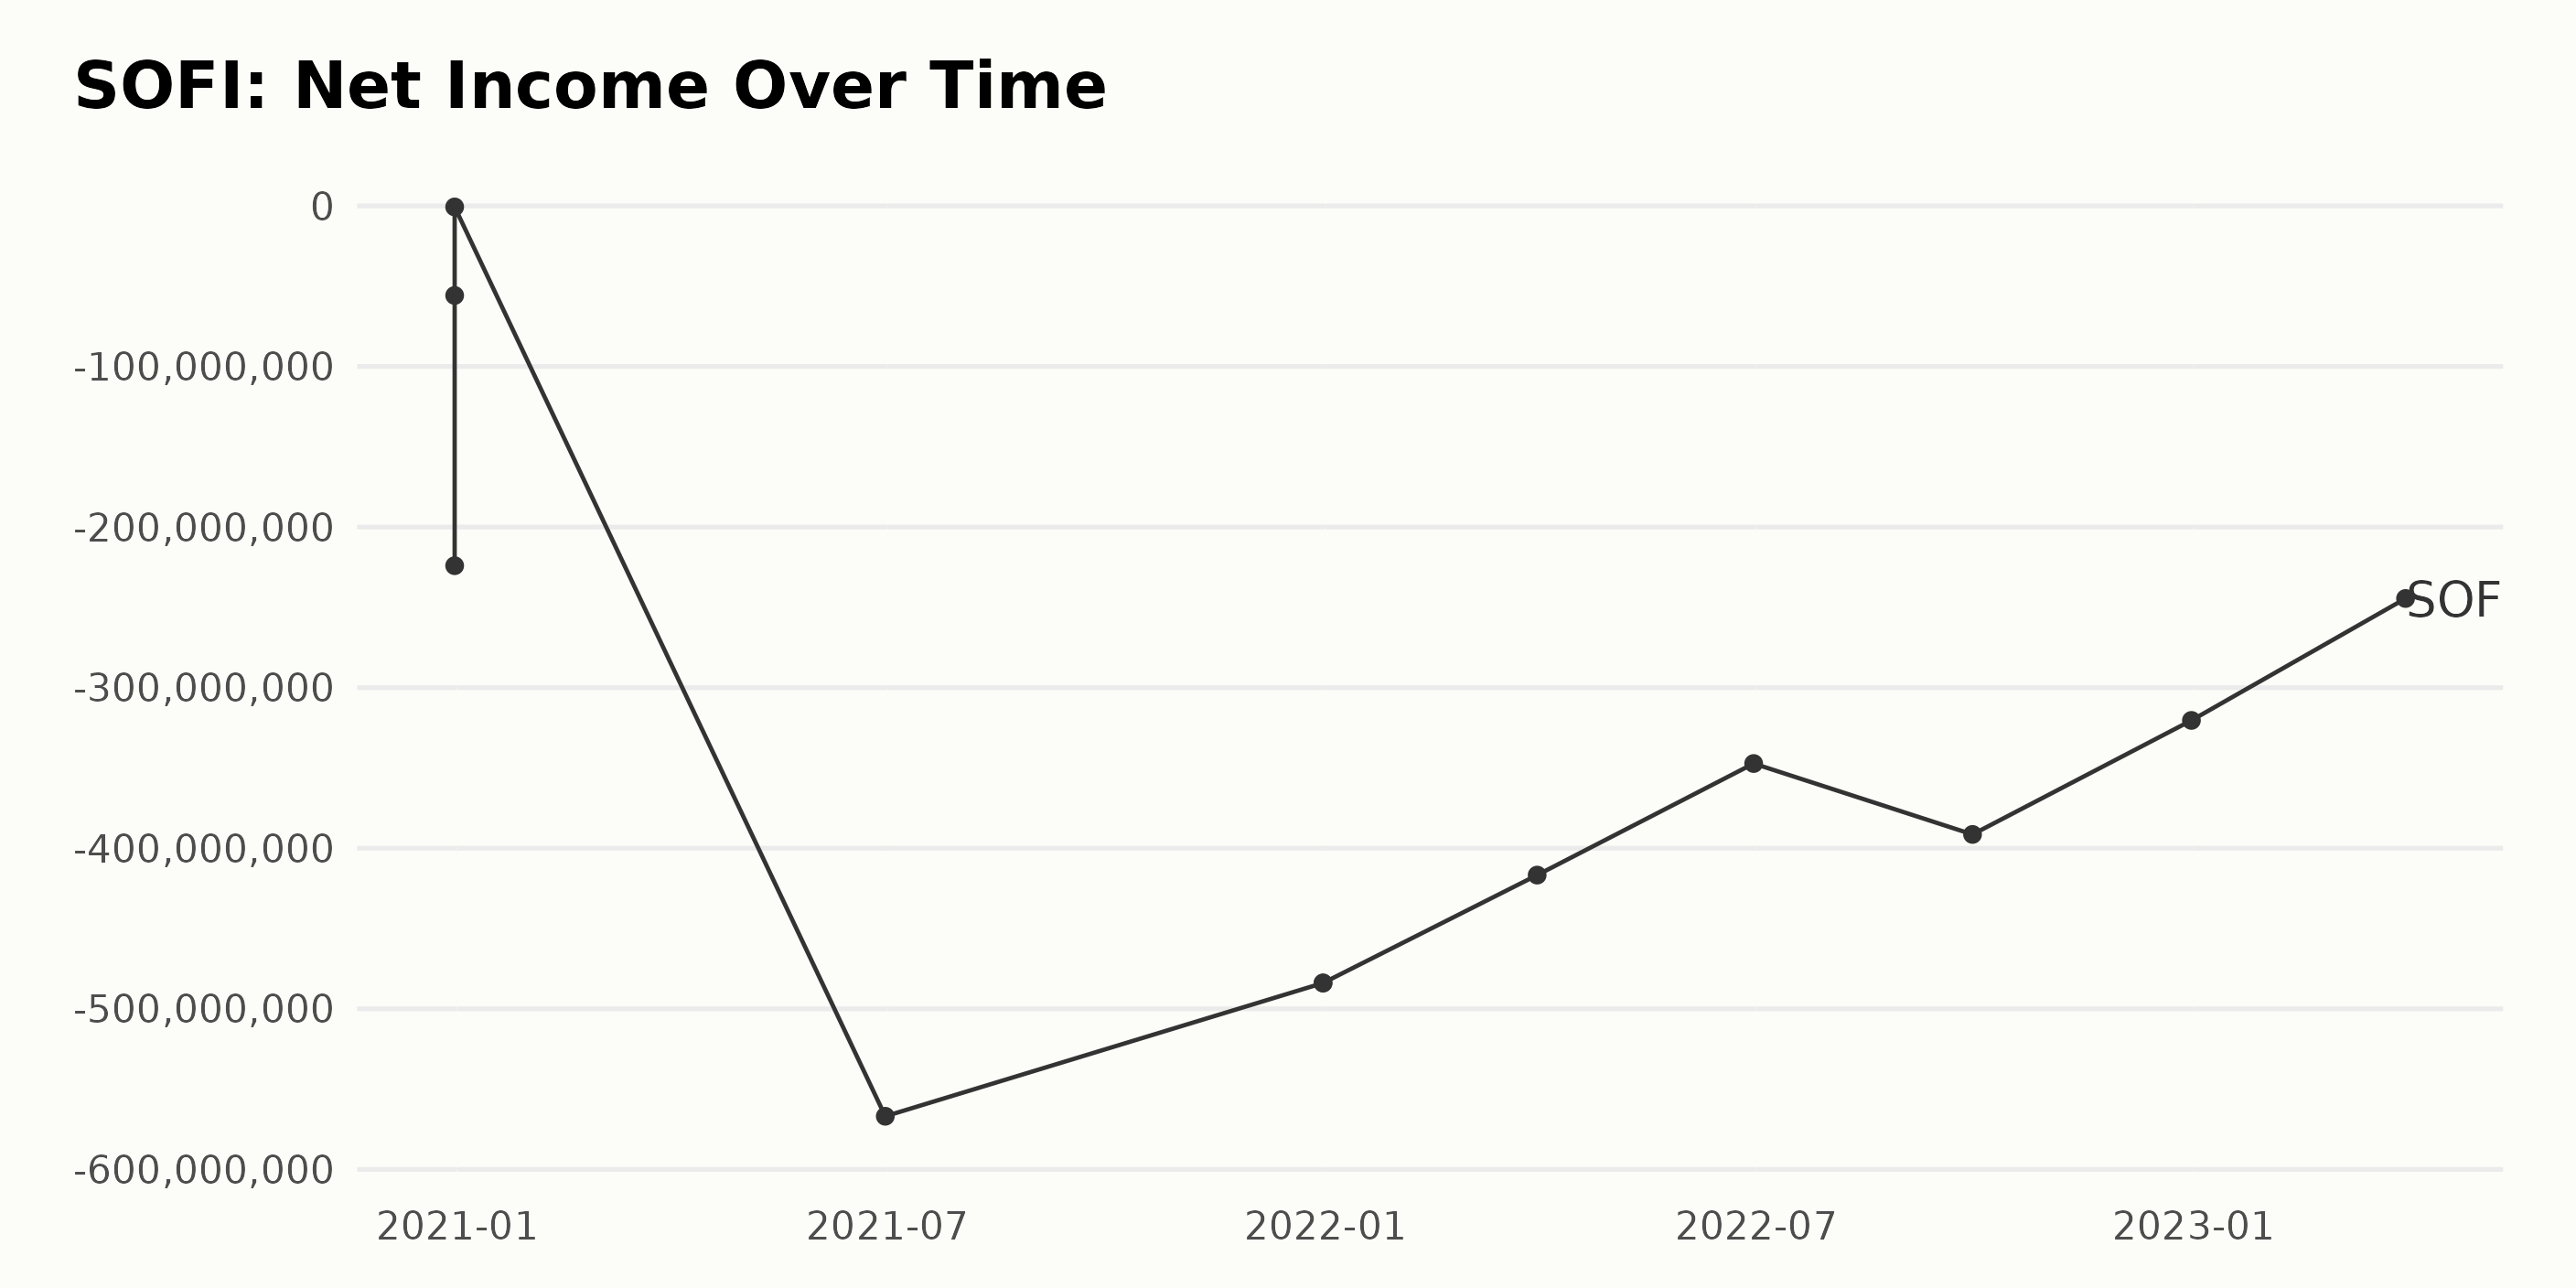
The trend in the trailing-12-month net income of SOFI indicates fluctuations from December 2020 to March 2023. However, there is an overall trend of decreasing net loss (i.e., a minimal reduction in negative net income).
- On December 31, 2020, the net income of SOFI stood at -$224.05 million, -$55.77 million, and -$0.65 million, denoting different business activities and performances.
- As of June 30, 2021, there was a significant increase in negative net income to -$566.93 million, indicating a substantial increase in losses.
- The net income slightly improved at the end of the year on December 31, 2021, standing at -$483.94 million.
- The first quarter of 2022 saw a further decrease in negative net income to -$416.73 million.
- However, the second quarter of 2022 witnessed an improvement in the net loss reducing it to -$347.25 million.
- On September 30, 2022, a slight increase in negative net income was observed at -$391.41 million.
- The net income numbers for SOFI started improving at the end of the year 2022 with a figure of -$320.41 million.
- Lastly, as of March 31, 2023, the net income shows an ameliorating trend at -$244.47 million.
Although its net losses declined, the company is still in the red.
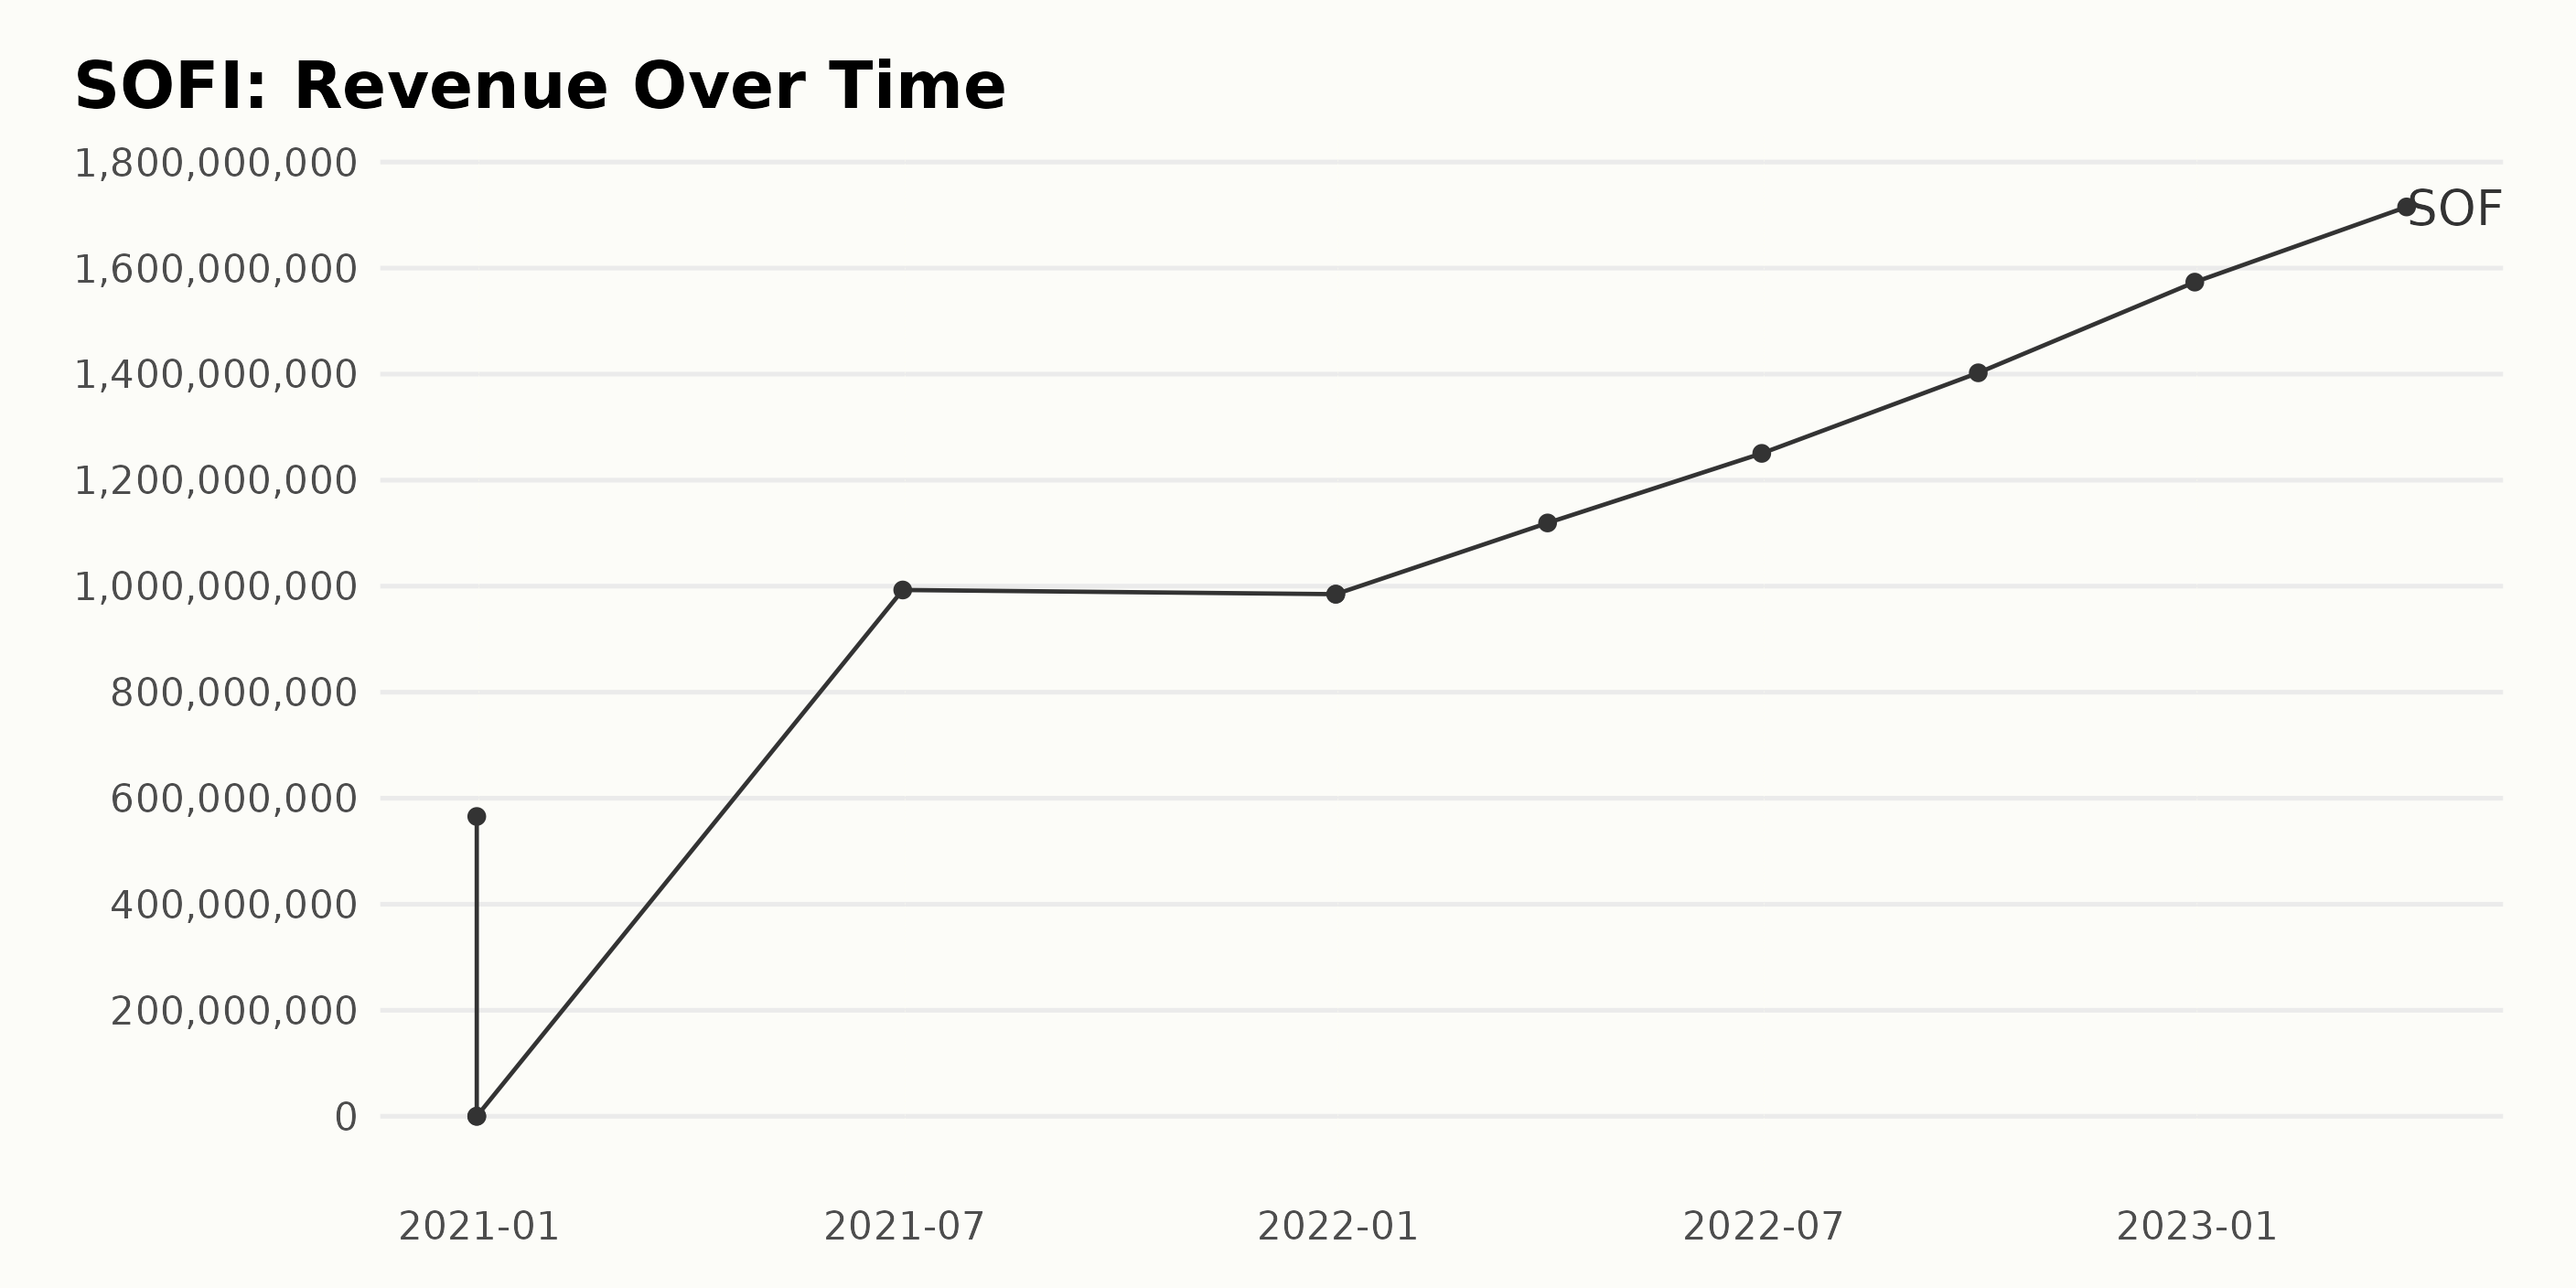
The trend of the trailing-12-month revenue for SOFI reveals a significant upward flow over the reported period. Considering the sequence implies:
- On December 31, 2020, revenue was at $565.53 million.
- We observed a substantial increase by June 30, 2021, when revenue was $992.79 million.
- As of December 31, 2021, it slightly dipped to $984.87 million, yet kept its value nearly the same across the repeated data points.
- For 2022, significant growth was noted, with the first quarter closing in March with revenue hitting $1.12 billion, then a rise to $1.25 billion in June and then $1.40 billion in September.
- The last recorded value, on December 31, 2022, saw the highest leap in this series, reaching an impressive mark of $1.57 billion.
- Revenue was $1.72 billion in the first quarter of 2023.
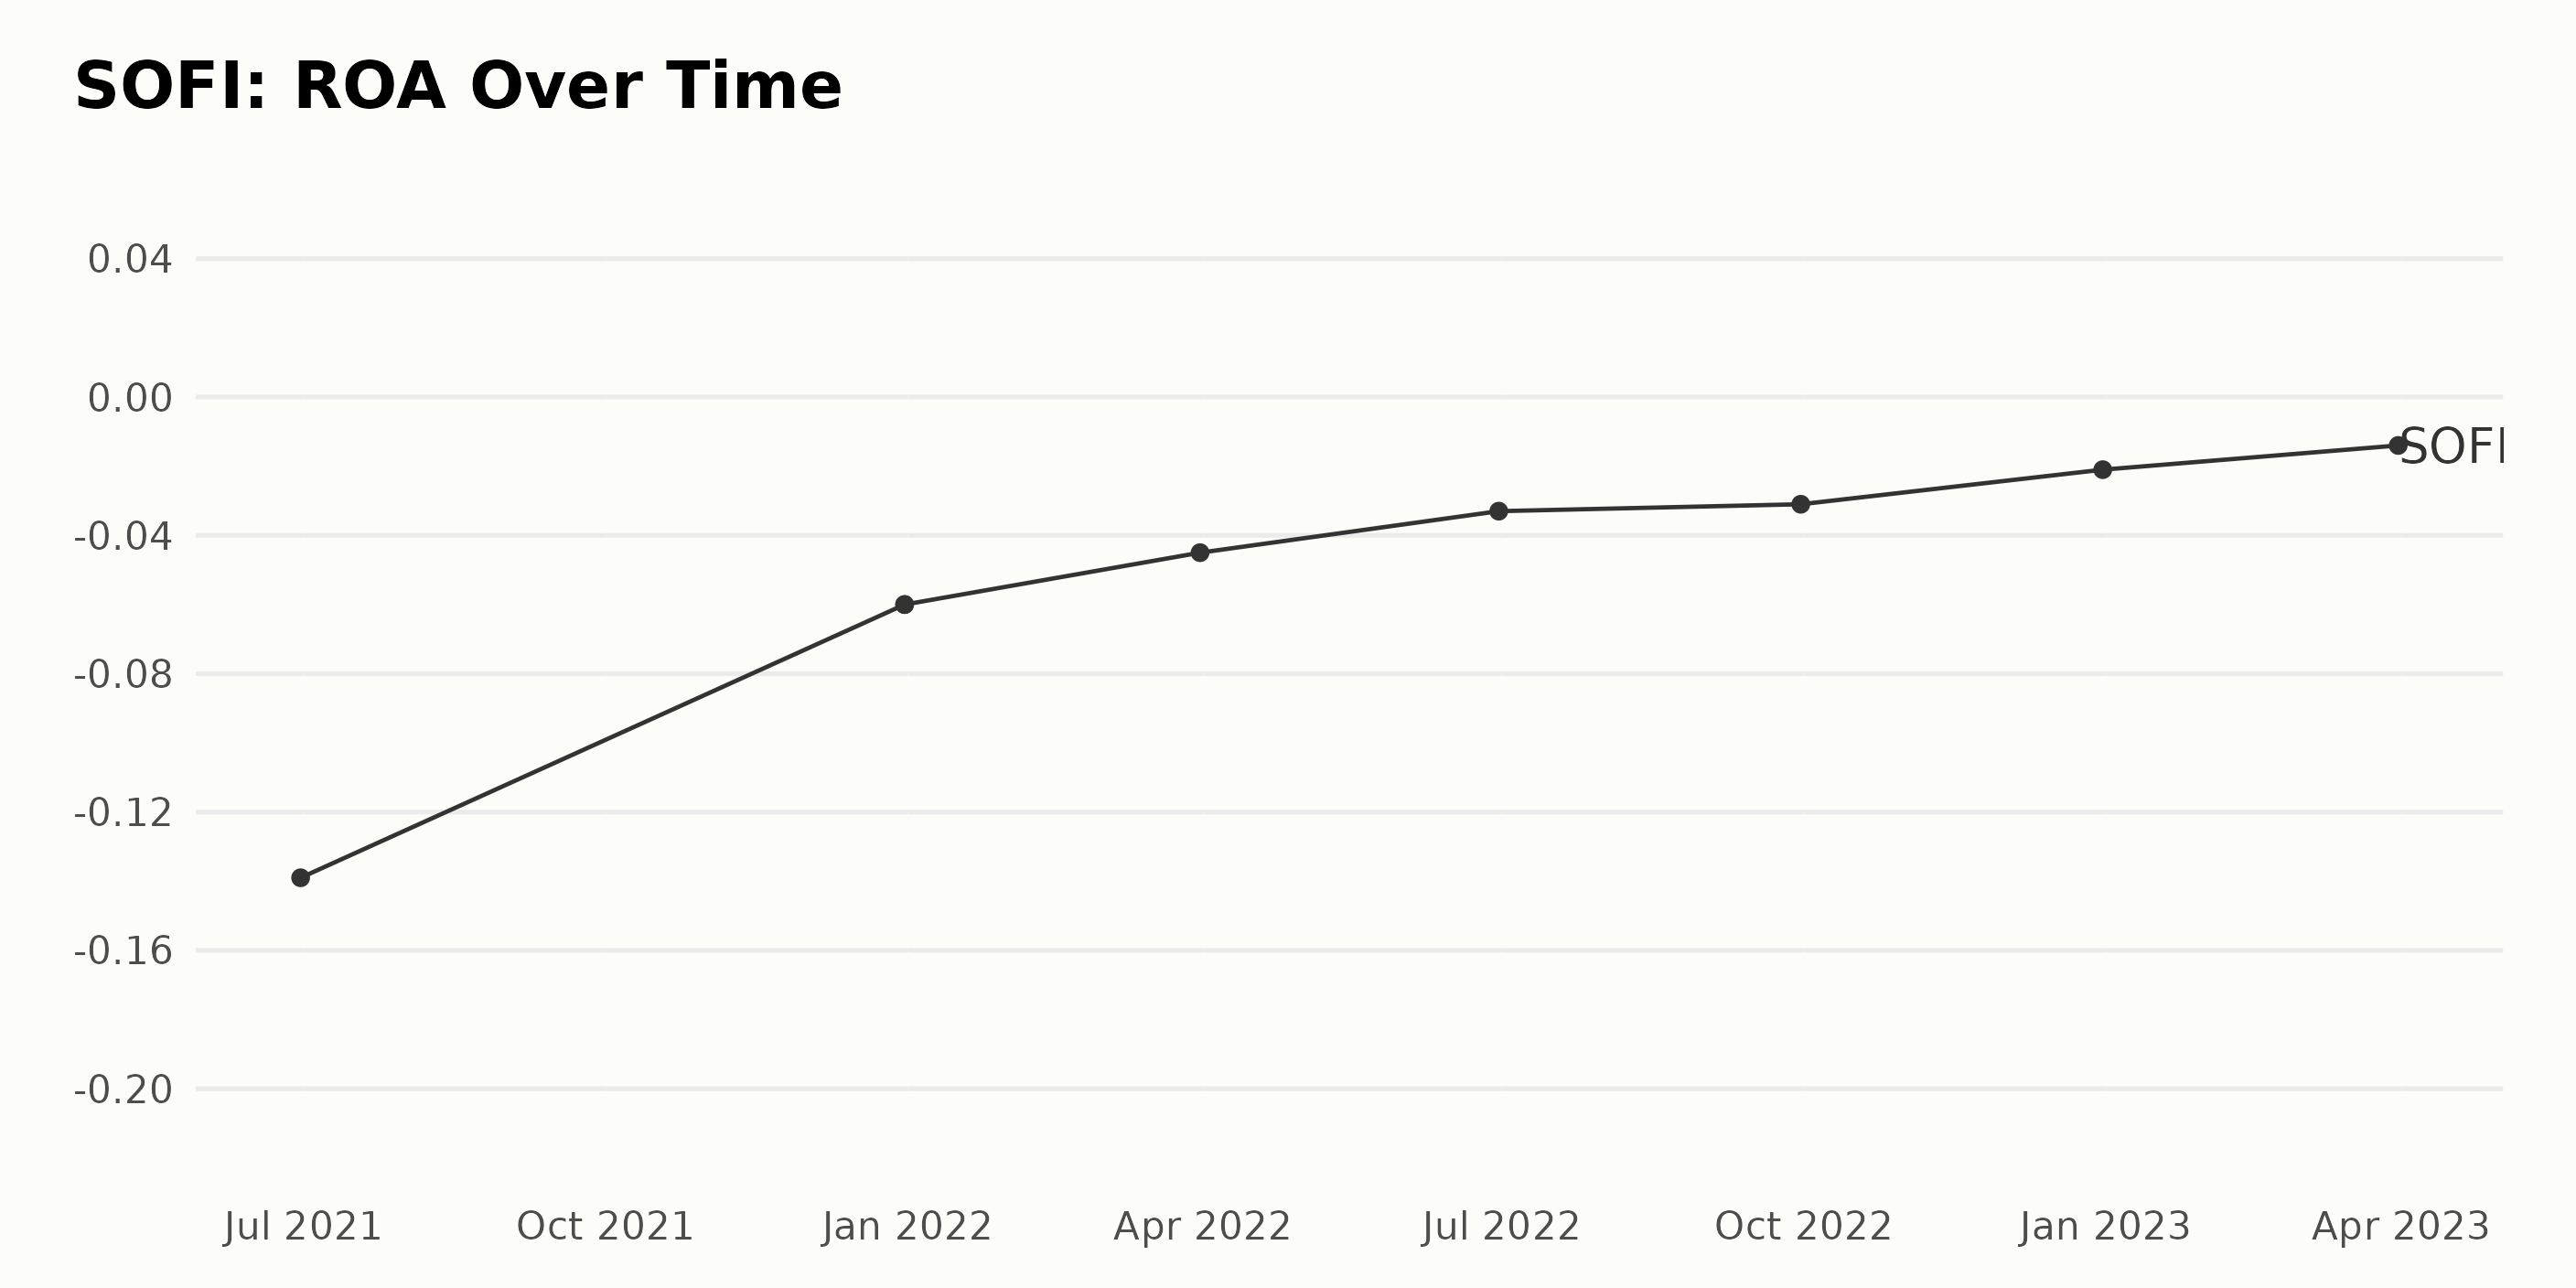
The Return on Assets (ROA) for SOFI exhibited a generally improving trend over the period from June 2021 to March 2023. Despite the figures demonstrating a steady decrease in losses, it fluctuated in the negative territory. Key points are summarized below:
- Starting at -13.9% in June 2021, SOFI’s ROA reflected notable financial distress.
- SOFI showed some recovery towards the end of 2021. Its ROA improved to -6.0% by December 31, 2021.
- This uptrend continued into 2022. As of March 31, 2022, and June 30, 2022, the ROA values were -4.5% and -3.3%, respectively.
- Following this, there was a somewhat steady ROA trend with minor fluctuations. The figures were at -3.1% and -2.1% for the quarters ending September 30, 2022, and December 31, 2022, respectively.
- The last recorded value from the first quarter of 2023 stood at -1.4%, showing the most significant improvements since records started in mid-2021.
It suggests that compared to its initial performance, SOFI has made significant strides in reducing the proportion of losses generated per asset value.
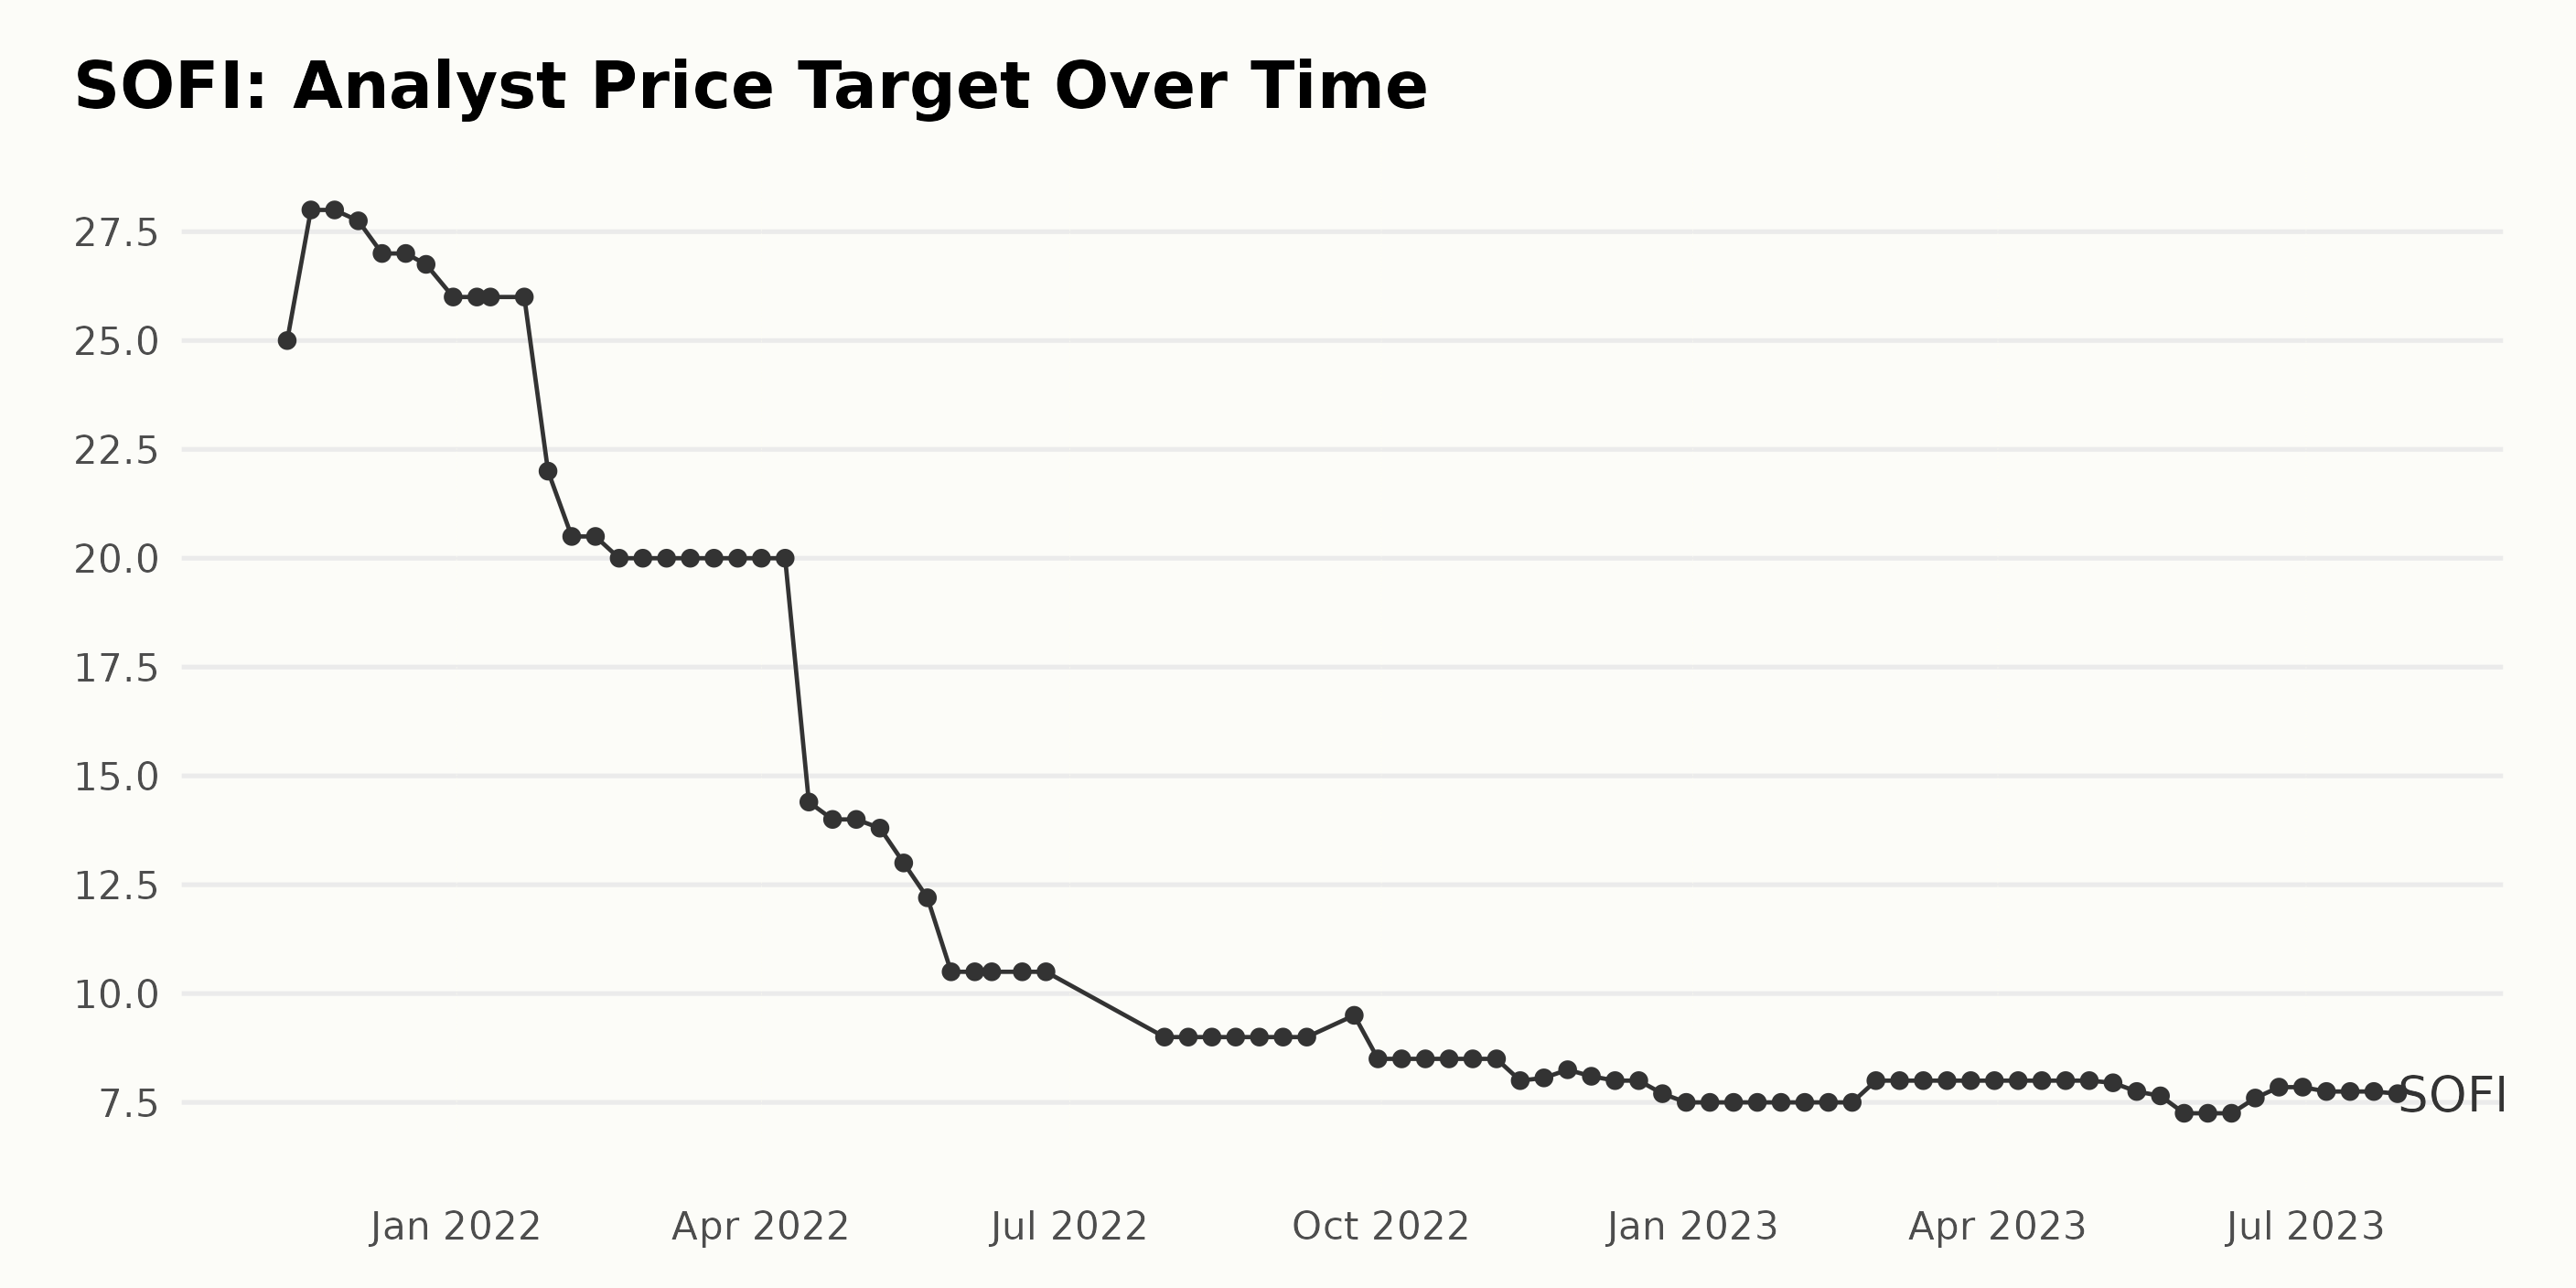
The Analyst Price Target for SOFI showed a clear downward trend over the period from November 2021 to July 2023. The data presents several notable patterns and fluctuations:
- From its peak at $28 in November 2021, SOFI’s Analyst Price Target witnessed a steep decline to its first significant trough of $20 by February 2022.
- There was then a brief period of stabilization around $20 before another sharp fall began in April 2022, bringing it down to an even lower level of $14 by mid-April.
- In May 2022, the Price Target experienced another drop, reaching its lowest point of $10.5, maintaining this value till June 2022.
- The subsequent months until September saw a further downward trend, after which there was a minor rebound to $9.5 in September, but soon after, it again dropped to $8.5.
- The Price Target held fairly steady at $8.5 for a while before gradually deteriorating further down to $7.5 by the end of December 2022, which persisted till the end of February 2023.
- The trend shows a slight recovery back to $8 in February 2023, which persisted till the end of April before falling off again. In the final data run from May to July 2023, the price target reduced steadily from $7.95 to $7.7.
Overall, the Analyst Price Target has depreciated from its initial value of $25 to its last recorded figure of $7.7. This is a significant decrease of approximately 69.2% over the time span.
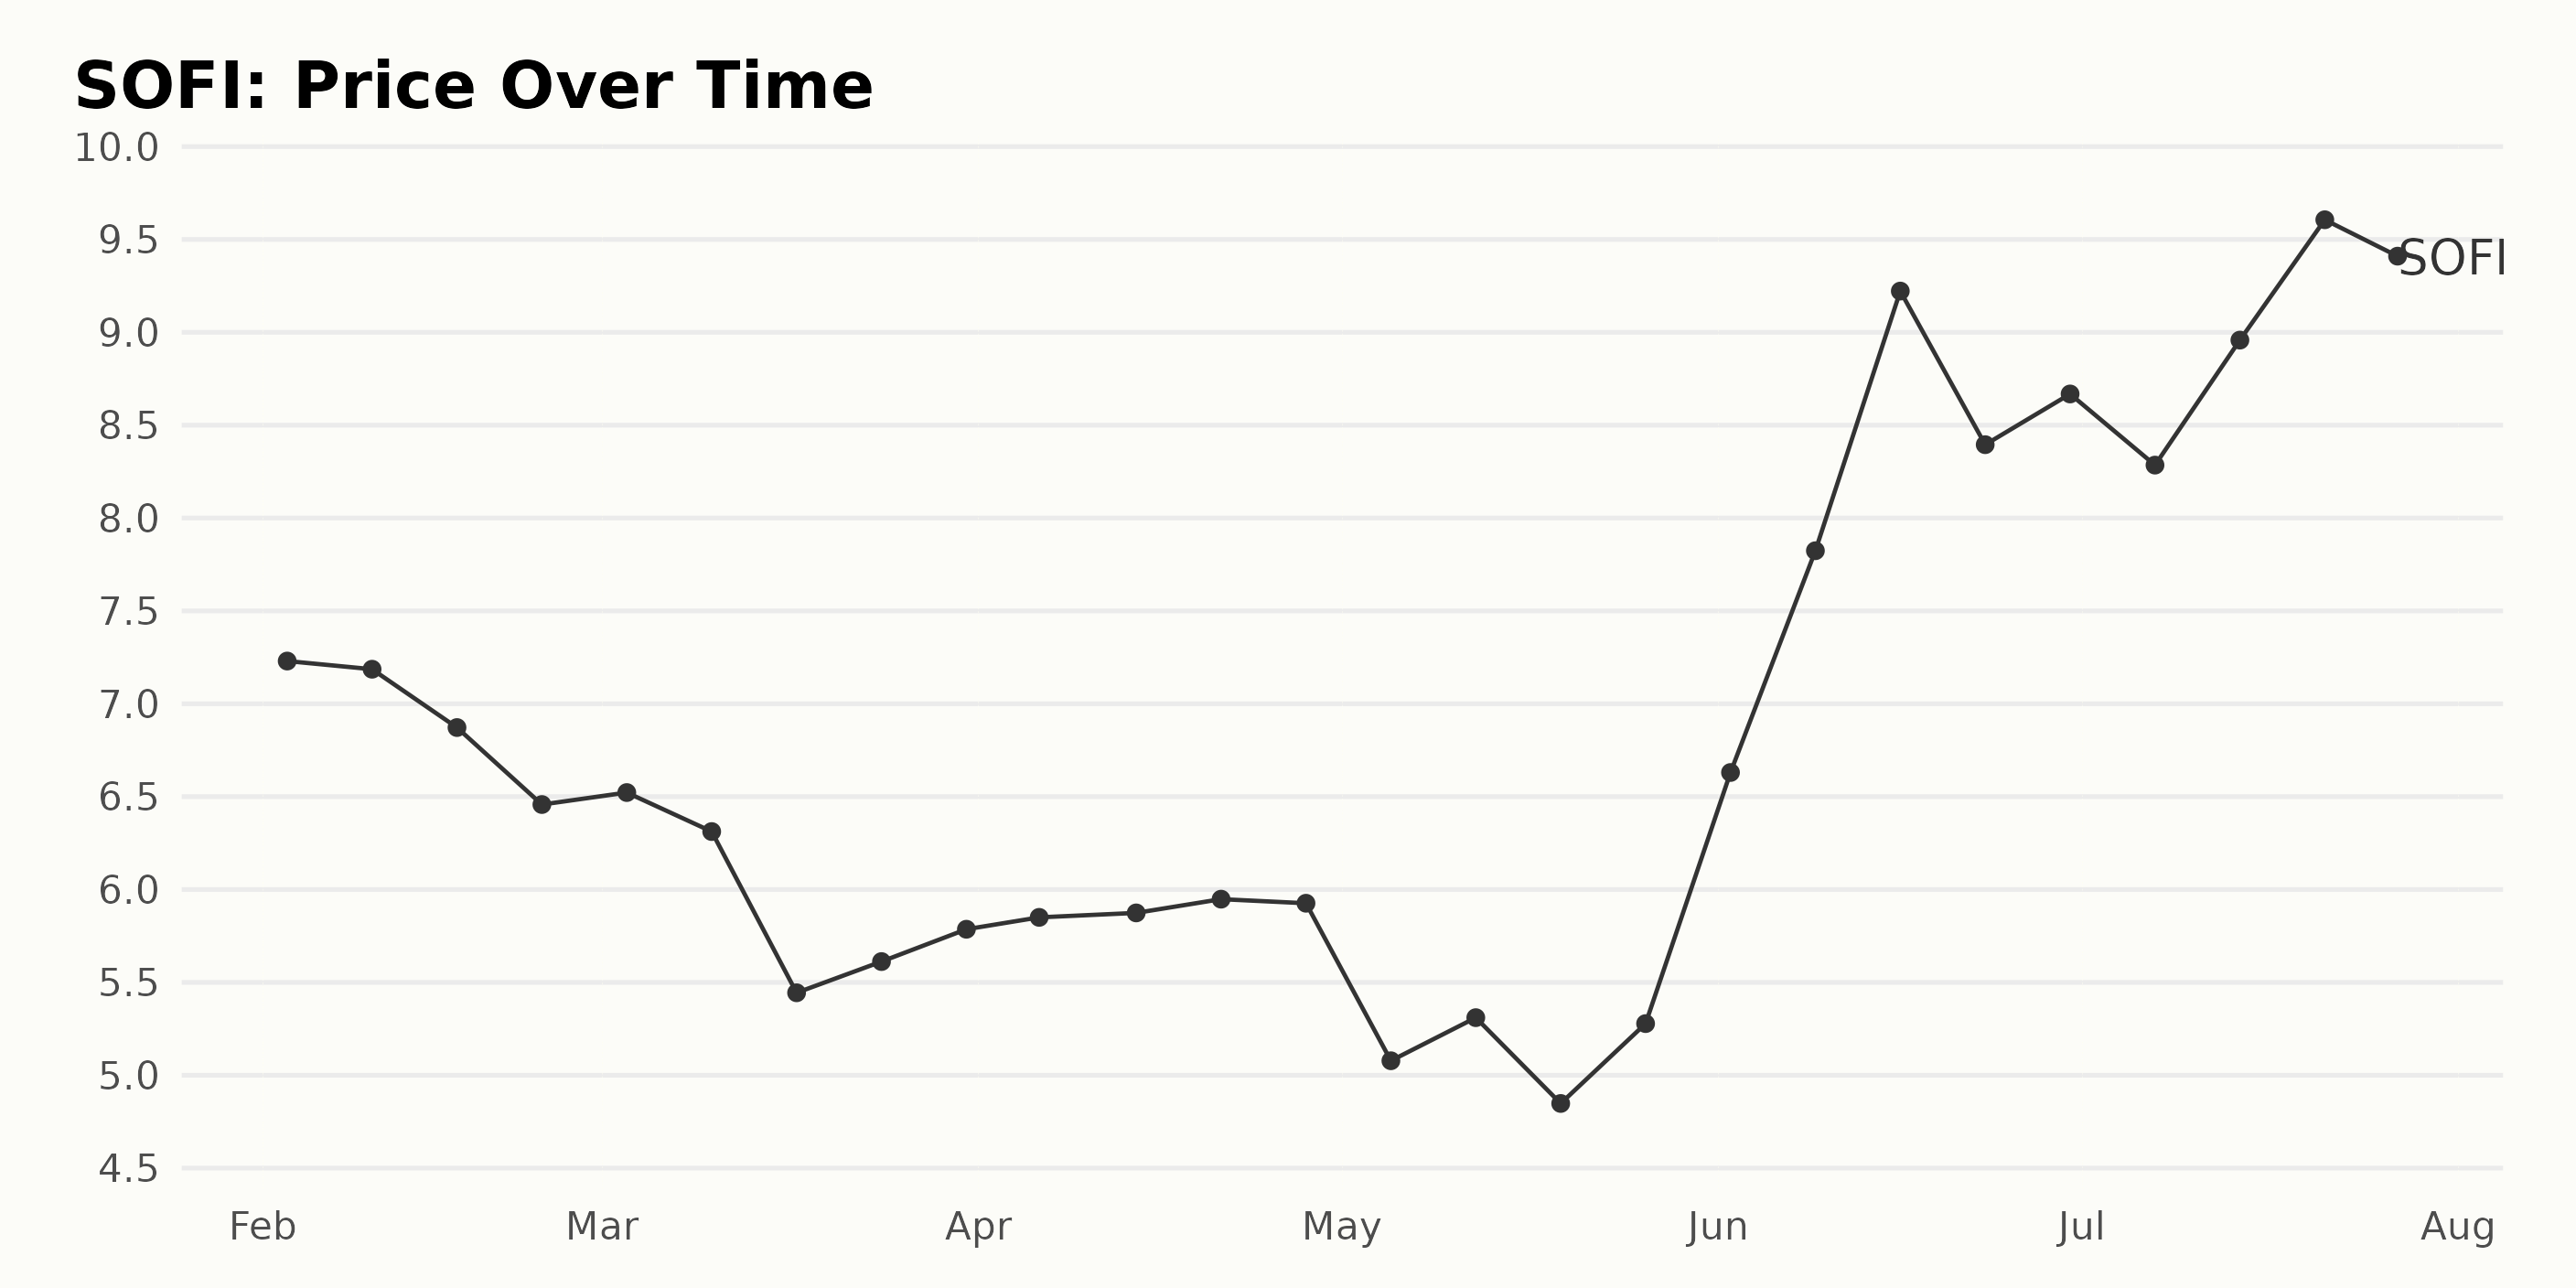
Analyzing the Dynamic Fluctuations in SOFI Shares: February to July 2023
The data provided offers a glimpse into the trend and growth rate of SOFI shares from February to July 2023.
- SOFI shares began at $7.23 on February 3, 2023.
- From February to mid-March, the share price consistently fell, reaching its lowest point for that period at $5.44 on March 17, 2023. This represents a significant deceleration in the company’s growth.
- However, by the end of March, there is a slow upward trend as the price recovers incrementally, reaching $5.87 by April 14, 2023.
- The price falters slightly at the beginning of May, falling to $5.08 on May 5, 2023.
- After this dip, there’s a strong surge from the end of May to June 16, 2023. The stock reaches its peak for the period under review at $9.22, representing an impressive turnaround and acceleration in growth.
- However, the progress is inconsistent, falling to $8.39 on June 23, 2023. A slight recovery is noted by the end of June with a value of $8.67.
- July showed more robust growth, with the stock closing at $9.09 on July 27, 2023. Although there was some volatility this month, the overall growth pattern appears positive.
In conclusion, SOFI shares show a pattern of initial decline followed by a period of growth with some fluctuations. While there were periods of deceleration (especially in late February through mid-March), the trend generally shows a marked acceleration, especially noticeable in the late May to mid-June period. Here is a chart of SOFI’s price over the past 180 days.
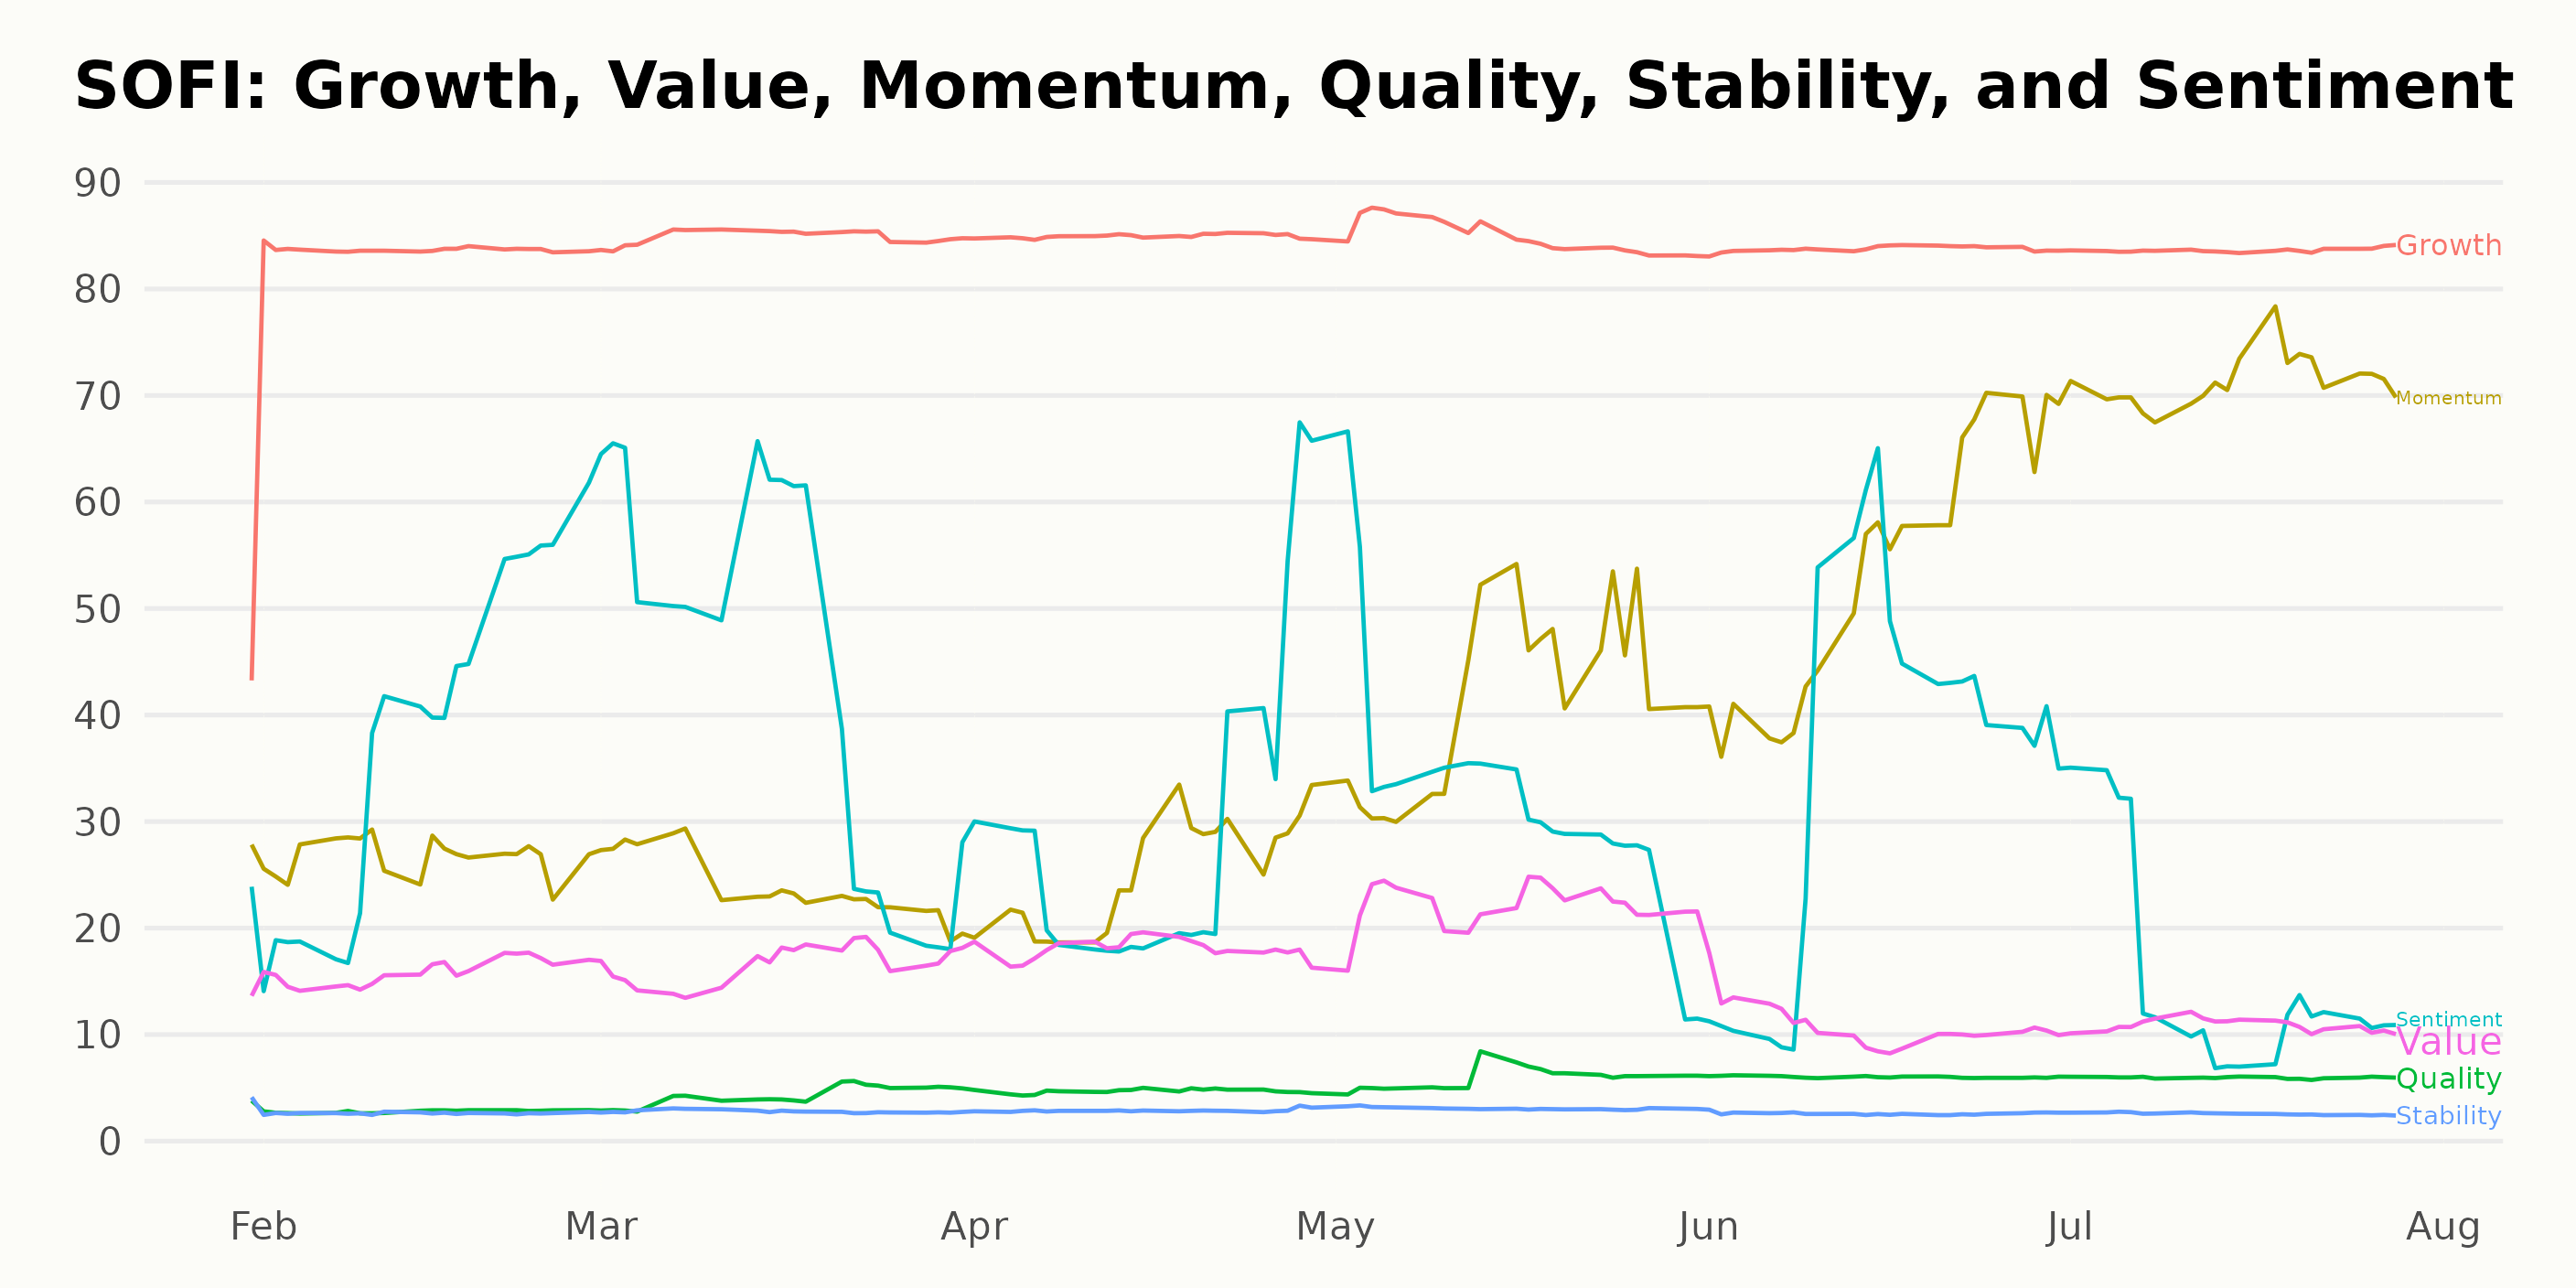
Examining SOFI’s POWR Ratings
SOFI has an overall D rating, translating to a Sell in our POWR Ratings system. It is ranked #92 out of the 99 stocks in the Financial Services (Enterprise) category. It has an F grade in Stability and a D in Value, Sentiment, and Quality.
According to the values provided, its POWR grade performance has fluctuated between D and F in the span from February to July 2023. Here’s a breakdown of notable points based on the data:
- Week of February 4, 2023: SOFI started the observation period with an F POWR grade, ranking 98 in its category.
- From the week of February 11 to March 25, 2023: The POWR grade improved to D. Meanwhile, its ranking saw a slight improvement as it rose from 98 to 93.
- In the weeks of April 1, 8, and 15: The POWR grade fell back to F, while its rank deteriorated to 95 and then slightly improved to 93.
- Commencing the week of April 22 and continuing to the week of July 27, 2023: The POWR grade remained steady at D, but its rank oscillated between 90 and 94 positions predominantly, except for brief improvements to the 85 and 86 positions in May. As of the most recent data point on July 27, 2023, SOFI holds a D grade in the POWR Ratings parameter while its position stands at 92 within the Financial Services (Enterprise) category of stocks.
Stocks to Consider Instead of SoFi Technologies, Inc. (SOFI)
Other stocks in the Financial Services (Enterprise) sector that may be worth considering are Jiayin Group Inc. (JFIN), Medallion Financial Corp. (MFIN), and CPI Card Group Inc. (PMTS) -- they have better POWR Ratings.
43 Year Investment Pro Shares Top Picks
Steve Reitmeister is best known for his timely market outlooks & unique trading plans to stay on the right side of the market action. Click below to get his latest insights…
Steve Reitmeister’s Trading Plan & Top Picks >
SOFI shares were trading at $9.46 per share on Friday afternoon, up $0.37 (+4.07%). Year-to-date, SOFI has gained 105.21%, versus a 20.27% rise in the benchmark S&P 500 index during the same period.
About the Author: Subhasree Kar

Subhasree’s keen interest in financial instruments led her to pursue a career as an investment analyst. After earning a Master’s degree in Economics, she gained knowledge of equity research and portfolio management at Finlatics.
The post Is SoFi Technologies (SOFI) a Good Financial Growth Stock to Watch? appeared first on StockNews.com