


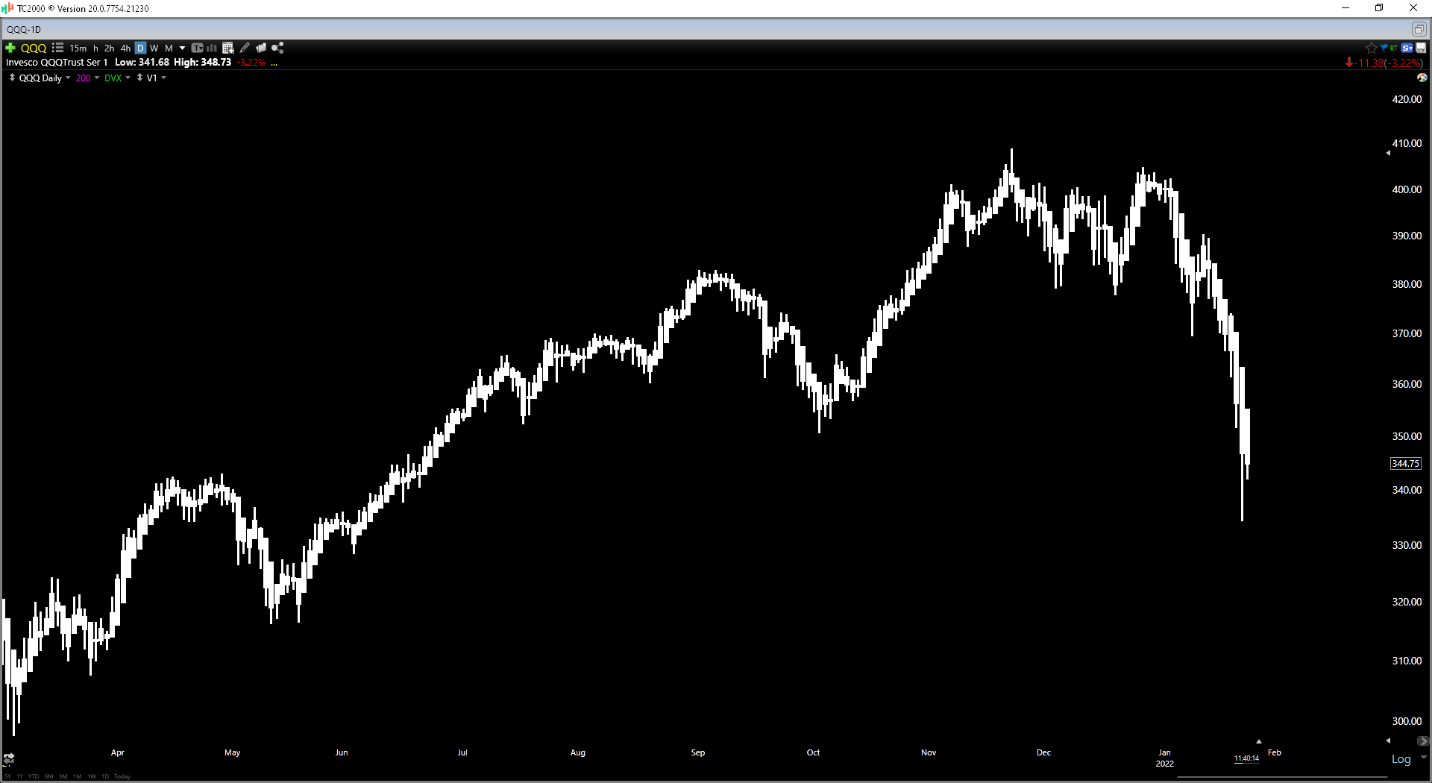
It's been a volatile start to the year for the major market averages, with the Nasdaq 100 Index (QQQ) down more than 13% year-to-date and the S&P-500 (SPY) down over 9%. One of the better performers among the carnage is silver (SLV), which has managed to hold onto a year-to-date gain, despite the most downside volatility we've seen since Q1 2020. This has not only improved silver's relative strength rating vs. other ETFs, but it should boost margins for producers and increase the likelihood of acquisitions in the sector over the next year.
(Source: TC2000.com)
Looking at the chart above, we can see that it's been a rough start to the year for the Nasdaq 100 Index, with the index on track for its worst January since 2008. Typically, during periods of significant market weakness, even perceived safe havens like gold and silver are battered, with the risk-off environment leading to cash being raised across the board, with money flowing into the US Dollar (UUP). However, while we have seen a flight to the US Dollar, silver is holding up remarkably well vs. other ETFs.
(Source: TC2000.com)
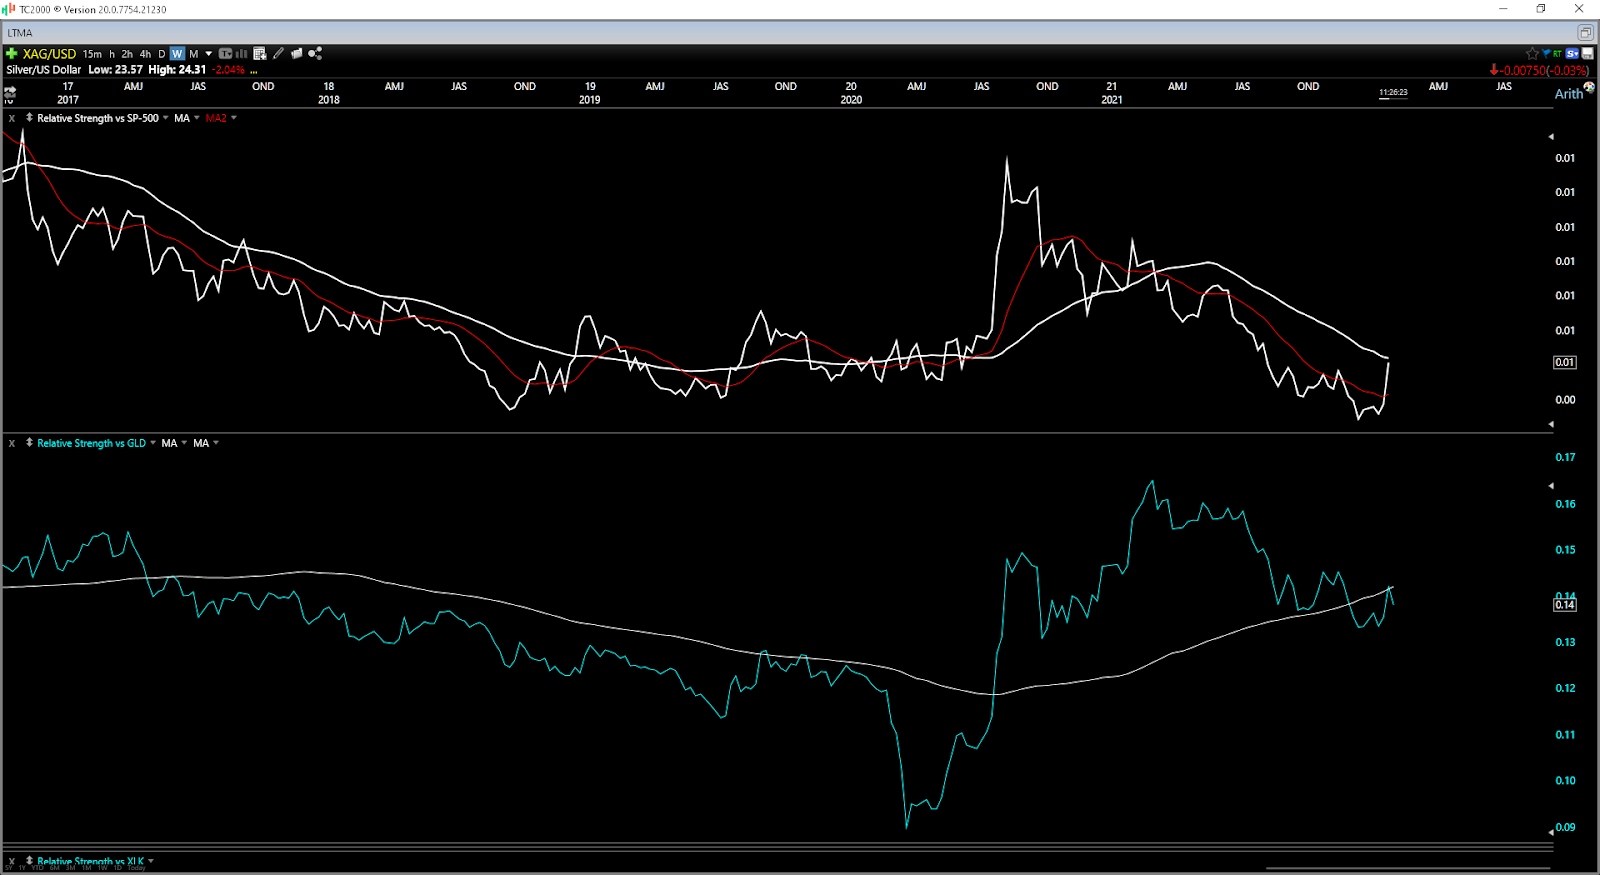
In fact, less than 20 trading days into the year, silver is ranked in the top 10% of ETFs from a year-to-date performance standpoint and is outperforming QQQ by more than 1500 basis points. This is a clear character change from last year when silver underperformed QQQ by more than 4000 basis points. As the chart above shows, these periods of strength when silver is outperforming the S&P-500 are very positive, with silver performing its best when it's above its key moving averages relative to the S&P-500. Silver's average 6-month draw up after regaining its weekly moving average was 46% the last two times this occurred.
If we look closer at periods when silver regained its moving average relative to the S&P-500 and was also outperforming gold (above its weekly moving average), the gains were even more impressive, with a 6-month draw-up of more than 50% from the June 2020 signal. Obviously, history does not have to repeat itself. Still, with silver attempting to regain its moving average vs. gold and near regaining its key moving average vs. S&P-500, the ingredients are in place for a strong year from the industrial metal.
(Source: TC2000.com)
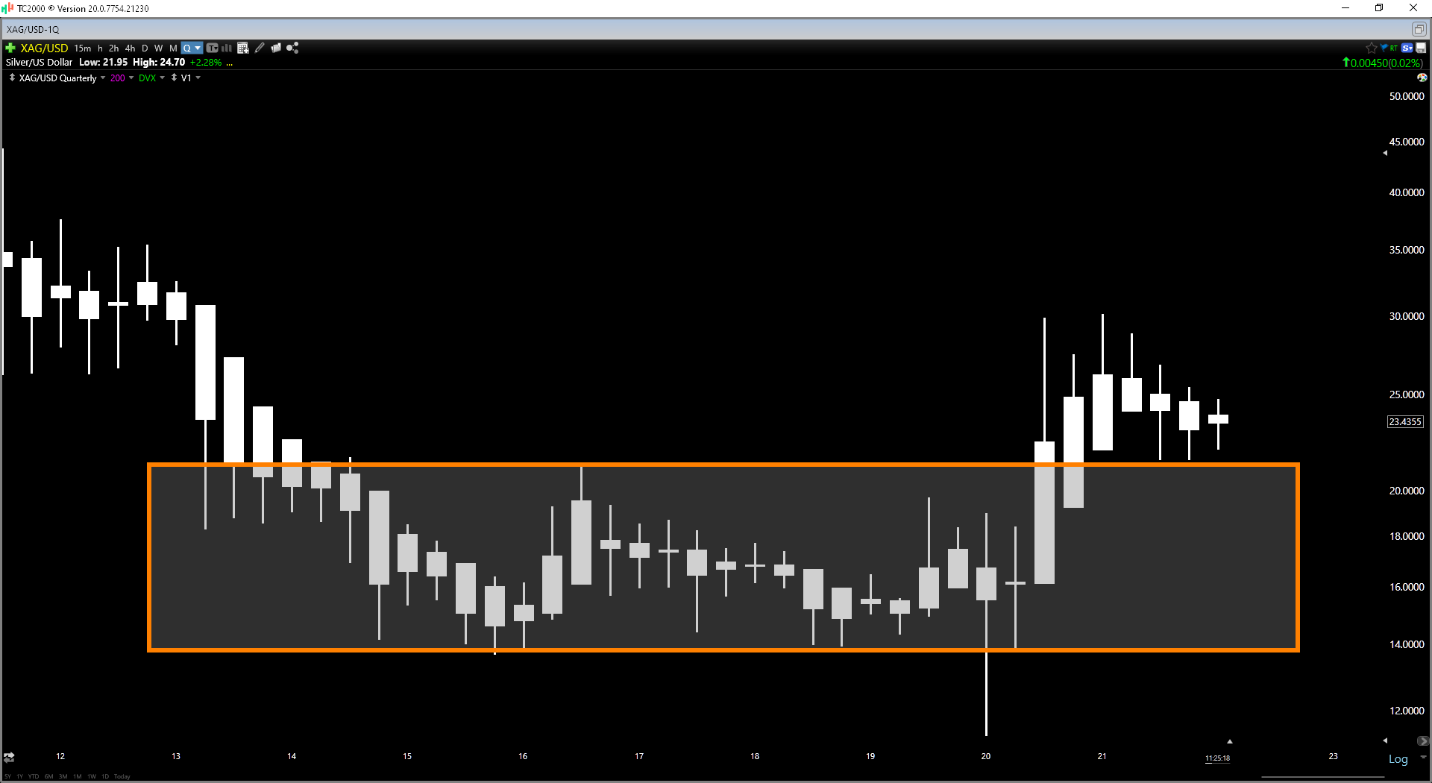
Moving over to silver's technical picture, we can see that the metal has spent nearly 18 months relieving its Q3 2020 overbought condition, following a massive breakout to new multi-year highs in July 2020. This consolidation forced many of the weaker hands out of the trade, given that multiple assets were moving higher, and there was a huge opportunity cost to holding silver if nearly every other market was in an intermediate uptrend.
However, with selling pressure across the board to start 2022, there is no opportunity cost to hold silver, reinforced by the fact that real rates are sitting at (-) 6%. This strong fundamental backdrop is combined with one of the best-looking quarterly charts across all other ETFs and indexes, with silver appearing to be backtesting its multi-year breakout. Typically, backtests that do not re-enter the prior base are bullish continuation patterns, suggesting that silver likely has a date with to $30.00/oz in the next 12-18 months to revisit its prior highs.
So, what's the best course of action?
(Source: TC2000.com)
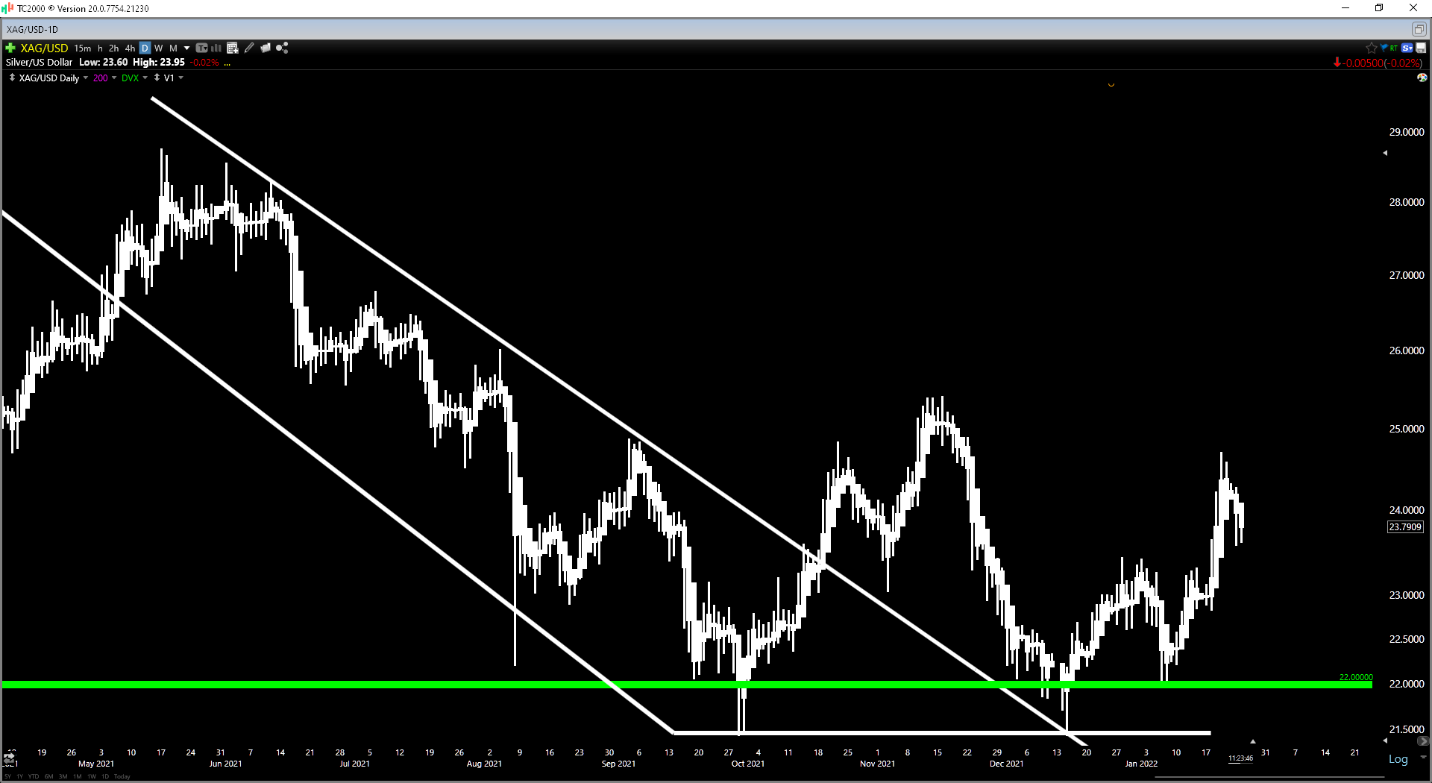
With silver continuing to build a massive base and making higher lows while the major market averages make lower lows, both the daily and monthly charts have now moved into a bullish posture. This suggests that any 10% pullbacks from the highs will present buying opportunities, suggesting that dips below $22.20/oz should offer a low-risk area to start new positions.
For investors that prefer to get leverage on the silver price, one of the more attractive ways to play the metal is Wheaton Precious Metals (WPM). This royalty/streaming company pays a ~1.5% dividend yield and is on track to grow attributable production by more than 15% between now and FY2026. The differentiator for WPM is that it has extremely high margins, given that it offers capital to miners/developers in exchange for a portion of the metals produced on their property. Despite its high margins and superior business model to producers, the stock has found itself trading at just ~25x FY2022 earnings, a deep discount to its historical multiple of 35x earnings.
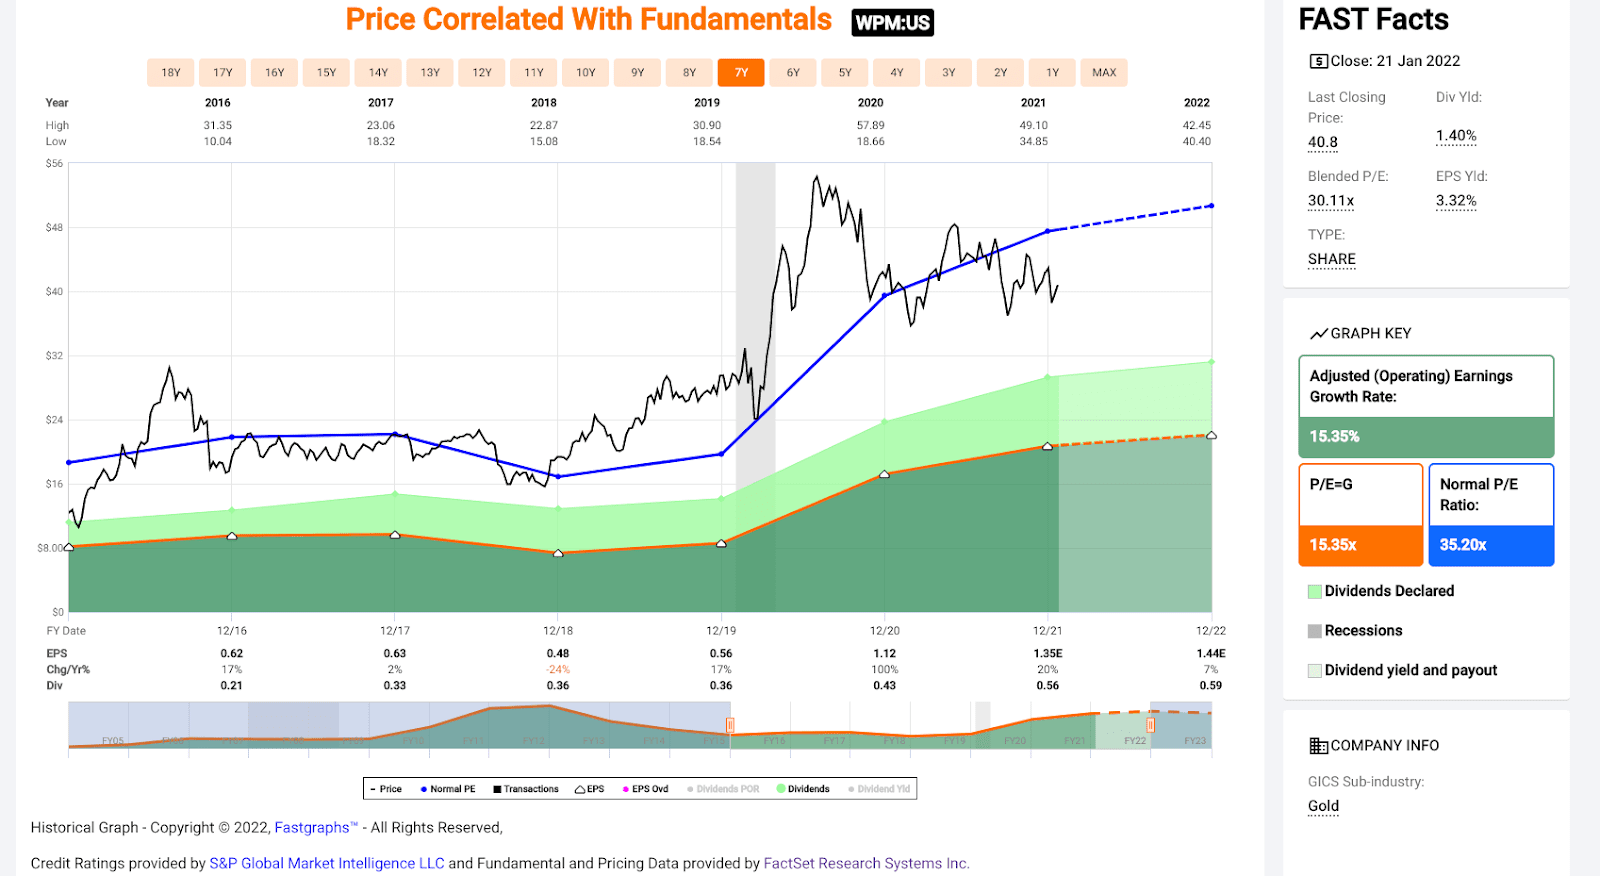
(Source: FASTGraphs.com)
Another way to get silver exposure is through GoGold Resources, a small producer in Mexico that is busy drilling its Los Ricos Project in Jalisco State. The company appears to be sitting on one of the most significant silver discoveries in years, with the potential to prove up over 400 million silver-equivalent ounces combined at its Los Ricos North and South projects. Given this significant mineral endowment, I see the stock as a likely takeover target, especially if silver prices move above $25.00/oz. As it stands, GoGold is just a two million-ounce per year producer but could increase production to 13+ million silver-equivalent ounces based on Los Ricos if it can bring both projects online.
To summarize, I remain bullish on silver medium-term and long-term, and the recent outperformance vs. gold and the S&P-500 is a very positive development. My preferred way to trade the metal is by buying in the lower portion of its trading range, with the updated low-risk buy zone coming in at $22.00/oz. However, for investors that prefer to get paid to wait and increase their leverage to the metal, Wheaton Precious Metals looks like the superior way to get exposure to silver. So, if we see WPM dip below $38.90, I will view this as a low-risk entry point into the stock.
Disclosure: I am long GLD, GLGDF
Disclaimer: Taylor Dart is not a Registered Investment Advisor or Financial Planner. This writing is for informational purposes only. It does not constitute an offer to sell, a solicitation to buy, or a recommendation regarding any securities transaction. The information contained in this writing should not be construed as financial or investment advice on any subject matter. Taylor Dart expressly disclaims all liability in respect to actions taken based on any or all of the information on this writing. Given the volatility in the precious metals sector, position sizing is critical, so when buying precious metals stocks, position sizes should be limited to 5% or less of one's portfolio.
SLV shares fell $0.02 (-0.09%) in after-hours trading Tuesday. Year-to-date, SLV has gained 2.37%, versus a -8.52% rise in the benchmark S&P 500 index during the same period.
About the Author: Taylor Dart

Taylor has over a decade of investing experience, with a special focus on the precious metals sector. In addition to working with ETFDailyNews, he is a prominent writer on Seeking Alpha. Learn more about Taylor’s background, along with links to his most recent articles.
The post Silver Showing Relative Strength During Selloff appeared first on StockNews.com