


Viacom Inc. (NASDAQ: VIAB, VIA) today reported financial results for the first quarter of fiscal year 2019 ended December 31, 2018.
This press release features multimedia. View the full release here: https://www.businesswire.com/news/home/20190205005426/en/

"Bumblebee," starring Hailee Steinfeld, has grossed over $450M at the global box office to date and has reinvigorated Paramount's "Transformers" franchise. (Photo: Paramount Pictures)
STATEMENT FROM BOB BAKISH, PRESIDENT & CEO
“Through strong execution of our strategic priorities, we delivered another quarter of solid financial and operational results. Beyond the growth at our flagship networks and the resurgence of Paramount Pictures, we took a major step forward in our evolution with an agreement to acquire Pluto TV. This service will create a scaled direct-to-consumer offering for Viacom, and expand our opportunities in next-generation distribution and advanced advertising. With this momentum, we are progressing toward a return to topline growth in 2019 as Viacom continues to evolve for the future.”
FISCAL YEAR 2019 RESULTS | |||||||||||||||||||||
Quarter Ended December 31 | |||||||||||||||||||||
| GAAP | 2018 | 2017 | B/(W) % | FX IMPACT % | CONSTANT | ||||||||||||||||
| Revenues | $ | 3,090 | $ | 3,073 | 1 | % | (3 | ) | % | 4 | % | ||||||||||
| Operating income | 602 | 718 | (16 | ) | |||||||||||||||||
| Net earnings from continuing operations attributable to Viacom | 318 | 535 | (41 | ) | |||||||||||||||||
| Diluted EPS from continuing operations | 0.79 | 1.33 | (41 | ) | |||||||||||||||||
Non-GAAP† | |||||||||||||||||||||
| Adjusted operating income | $ | 750 | $ | 718 | 4 | % | (2 | ) | % | 6 | % | ||||||||||
| Adjusted net earnings from continuing operations attributable to Viacom | 453 | 413 | 10 | (3 | ) | 13 | |||||||||||||||
| Adjusted diluted EPS from continuing operations | 1.12 | 1.03 | 9 | (4 | ) | 13 | |||||||||||||||
* We calculate constant currency information by converting current-period local currency results using prior-year period average foreign currency exchange rates. | |||||||||||||||||||||
† Non-GAAP measures referenced in this release are detailed in the Supplemental Disclosures at the end of this release. | |||||||||||||||||||||
MEDIA NETWORKS
Viacom Media Networks increased worldwide affiliate revenues and accelerated growth in Advanced Marketing Solutions, while continuing to expand global studio production and digital reach.
QUARTERLY FINANCIAL RESULTS | ||||||||||||||||||||||||||||||||||||||||||
FQ1'19 | TOTAL | B/(W)% | FX IMPACT % | CONSTANT | DOMESTIC | B/(W)% | INTERNATIONAL | B/(W)% | FX IMPACT % | CONSTANT | ||||||||||||||||||||||||||||||||
| Revenues | $ | 2,498 | (2 | ) | % | (2 | ) | % | - | % | $ | 1,933 | - | % | $ | 565 | (10 | ) | % | (10 | ) | % | - | % | ||||||||||||||||||
| Advertising | 1,230 | (6 | ) | (4 | ) | (2 | ) | 907 | (3 | ) | 323 | (13 | ) | (13 | ) | - | ||||||||||||||||||||||||||
| Affiliate | 1,169 | 3 | (1 | ) | 4 | 969 | 5 | 200 | (7 | ) | (7 | ) | - | |||||||||||||||||||||||||||||
| Consumer Products, Recreation & Live Events* | 99 | (12 | ) | (2 | ) | (10 | ) | 57 | (15 | ) | 42 | (9 | ) | (7 | ) | (2 | ) | |||||||||||||||||||||||||
| Adjusted OI | $ | 913 | - | % | (2 | ) | % | 2 | % | |||||||||||||||||||||||||||||||||
* Beginning Q1 2019, Media Networks revenue components previously reported as Ancillary were renamed to Consumer Products, Recreation and Live Events. Furthermore, certain components previously reported as Ancillary were reclassified to Affiliate. Prior period amounts have been recast to conform to the current presentation. | ||||||||||||||||||||||||||||||||||||||||||
† Non-GAAP measures referenced in this release are detailed in the Supplemental Disclosures at the end of this release. | ||||||||||||||||||||||||||||||||||||||||||
- Media Networks’ performance largely reflects the unfavorable impact of foreign exchange on international revenues. Excluding a 10-percentage point unfavorable impact from foreign exchange, international revenues were substantially flat.
- Domestic revenues held flat as lower advertising and consumer products, recreation and live events revenues were offset by affiliate growth, marking the fourth straight quarter of sequential improvement and second straight quarter of YOY growth in domestic affiliate revenues.
- Growth in domestic affiliate revenues was driven by contractual rate increases, as well as OTT and studio production revenues. On a constant currency basis, international affiliate revenues were flat in the quarter.
- Higher pricing and accelerated growth in Advanced Marketing Solutions (AMS) revenues, which increased +54% YOY, drove sequential improvement in domestic advertising revenues. On a constant currency basis, international advertising revenues were flat.
- The decrease in revenues from consumer products, recreation and live events reflects the release of the South Park: The Fractured But Whole video game in the prior year.
- Adjusted OI held flat, reflecting a decrease in SG&A expenses, primarily driven by lower advertising and promotion expenses, as well as cost transformation savings. On a constant currency basis, adjusted OI grew +2%.
Operational Highlights
-
Viacom maintained the #1 share of basic cable viewing with key
domestic audiences in the quarter, including the 2-49, 2-11, 18-34 and
18-49 demos, among others.
- In Live+SD viewing, Viacom held six of the Top 10 original cable series with P18-34 and nine of the Top 10 with P2-11.
-
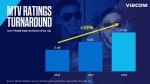
MTV accelerated its domestic ratings growth and expanded deeper into
live events:
- Grew audience share +15% YOY among P18-49 and broke a network record with six straight quarters of YOY primetime ratings growth in C3 among P18-34.
- In November, MTV acquired the SnowGlobe Music Festival, which drew roughly 50,000 fans to its three-day New Year’s Eve event in Lake Tahoe.
- Comedy Central achieved its seventh consecutive quarter of Total Day share growth among Adults 18-49, while Paramount Network grew share +5% YOY in this demo.
- Viacom International Media Networks delivered strong viewership, with MTV and Paramount Network increasing YOY share +11% and +7%, respectively. Telefe achieved its highest annual share in 10 years and Channel 5 produced five straight months of YOY share growth.
- Viacom International Studios (VIS) recently announced deals to produce content for Amazon, Claro, Imagen, Mediapro and Mega, building its position as a leading global producer of Spanish language content.
-
Viacom Digital Studios (VDS) continued to grow digital consumption
while expanding studio production through original content from
Awesomeness.
- VDS increased watch time +129% YOY and grew video views +65% YOY in the quarter.
- Awesomeness' first quarter releases included Light As a Feather on Hulu which was recently renewed for an additional 16 episodes. The company is also producing a sequel to Netflix's hit film To All the Boys I've Loved Before.
FILMED ENTERTAINMENT
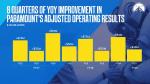
Paramount Pictures delivered double-digit topline growth and an eighth straight quarter of improved year-over-year adjusted operating results, driven by worldwide theatrical gains, continued momentum at Paramount Television and international theme park revenues.
QUARTERLY FINANCIAL RESULTS | ||||||||||||||||||||||||||
FQ1'19 | TOTAL | B/(W)% | DOMESTIC | B/(W)% | INTERNATIONAL | B/(W)% | ||||||||||||||||||||
| Revenues | $ | 621 | 14 | % | $ | 366 | 36 | % | $255 | (7 | ) | % | ||||||||||||||
| Theatrical | 149 | 49 | 89 | 44 | 60 | 58 | ||||||||||||||||||||
| Home Entertainment | 178 | (3 | ) | 111 | 12 | 67 | (20 | ) | ||||||||||||||||||
| Licensing | 220 | 3 | 128 | 71 | 92 | (33 | ) | |||||||||||||||||||
| Ancillary | 74 | 54 | 38 | 12 | 36 | 157 | ||||||||||||||||||||
| Adjusted OI | $ | (90 | ) | 31 | % | |||||||||||||||||||||
All figures are presented on a reported segment basis as impact from foreign exchange is not material. | ||||||||||||||||||||||||||
- Paramount Pictures improved YOY adjusted OI by $40 million – its eighth consecutive quarter of improvement.
- Filmed Entertainment revenue growth was primarily driven by strength in theatrical revenues, as well as increases in licensing revenues from TV production and ancillary revenues.
- Theatrical revenue gains were largely due to the performances of Bumblebee and Instant Family compared to releases in the prior year quarter.
- Lower home entertainment revenues reflect a decrease in the sales of DVDs and Blu-ray discs, partially offset by digital sales growth.
-
Increased production from Paramount Television, including the first
quarter release of Netflix’s The Haunting of Hill House,
primarily drove growth in licensing revenues.
- Paramount Television revenues were up +84% YOY in the quarter.
- Growth in worldwide ancillary revenues was primarily driven by license fees related to the development of two Paramount-branded theme parks in Asia.
Operational Highlights
- Bumblebee reinvigorated the Transformers franchise. The film has grossed over $450 million at the global box office to date, and is solidly profitable.
- Paramount’s expanded fiscal 2019 film slate includes the upcoming premiere of BET-branded film What Men Want (Feb. 8).
-
Paramount Television continued to expand a fast- growing studio
production business for Viacom, delivering two titles that premiered
in the first quarter:
- The Haunting of Hill House on Netflix.
- Season 3 of spy thriller Berlin Station on Epix.
- In November 2018, Paramount Pictures entered into an agreement with Netflix to produce original films for the streaming service.
- Paramount Pictures renewed or improved Pay output deals in the UK, Germany, Canada, Italy, India and Australia, and completed library deals with Amazon (global) and Sky (UK).
-
Paramount Pictures continued to diversify into adjacent businesses and
expand its footprint off-screen:
- The studio closed two deals in the quarter for the development of Paramount-branded theme parks in China and South Korea.
- Mean Girls on Broadway has grossed over $67 million to date, breaking venue records.
SPOTLIGHT ON PLUTO TV
Viacom continued to advance its evolution with an agreement to acquire Pluto TV, the leading free streaming television platform in the U.S.
- On January 22, 2019, Viacom announced an agreement to acquire Pluto TV for $340 million, with an expected close in FQ2’19, pending regulatory approval.
-
With more than 12 million monthly active users (as of December 2018) -
7.5 million of whom are on connected TVs- Pluto TV offers over 100
live linear channels and over 5,000 hours of on-demand content,
including movies, news, sports, general entertainment and digital
series.
- The service is universally available across mobile devices, desktops, streaming players and game consoles, and is expected to be enabled on 30M+ additional devices over the coming months.
- It is deeply integrated with a growing number of Smart TV manufacturers, including Samsung and Vizio, which represent about 60% of the market.
-
Upon closing, Pluto TV will:
- Provide Viacom a scaled direct-to-consumer offering with access to millions of consumers, and serve as an important marketing engine to grow our targeted subscription products, including Noggin and Comedy Central Now.
- Enhance Viacom’s Advanced Marketing Solutions business, immediately adding billions of quality addressable ad impressions per month, and bring in an additional audience that is young, gender-balanced and hard to reach.
- Add an important offering for distribution partners, including mobile operators, by creating a premium free service for broadband-only and other subscribers.
- Create an opportunity to monetize Viacom library product, benefitting from our strategic decision to curtail the licensing of large library packages to SVOD over the last two years.
- Leverage Viacom’s global reach, infrastructure and capabilities to drive opportunity, including a near-term Spanish language offering, both in the U.S. and Latin America.
- Accelerate its leadership in free streaming TV with Viacom content offerings across kids, African American, reality and comedy.
BALANCE SHEET AND LIQUIDITY
Continued progress in executing de-levering actions further strengthened the balance sheet and delivered improvements across key metrics.
-
At December 31, 2018, gross debt outstanding was $8.96 billion, a
reduction of approximately $1.1 billion from September 30, 2018, and
approximately $4.2 billion since Viacom announced its strategy to
de-lever in February 2017. Adjusted gross debt was $8.31 billion.
- Viacom executed an upsized tender offer for $1.1 billion of senior notes and debentures in the quarter.
- Cash and cash equivalents decreased $1.0 billion to $534 million.
- Net cash provided by operating activities increased $216 million to $228 million.
- Free cash flow increased $207 million to $191 million.
About Viacom
Viacom creates entertainment experiences that drive conversation and culture around the world. Through television, film, digital media, live events, merchandise and solutions, our brands connect with diverse, young and young at heart audiences in more than 180 countries.
For more information on Viacom and its businesses, visit www.viacom.com. Viacom may also use social media channels to communicate with its investors and the public about the company, its brands and other matters, and those communications could be deemed to be material information. Investors and others are encouraged to review posts on Viacom’s Twitter feed (twitter.com/viacom), Facebook page (facebook.com/viacom) and LinkedIn profile (linkedin.com/company/viacom).
Cautionary Statement Concerning Forward-Looking Statements
This news release contains both historical and forward-looking statements. All statements that are not statements of historical fact are, or may be deemed to be, forward-looking statements. Forward-looking statements reflect our current expectations concerning future results, objectives, plans and goals, and involve known and unknown risks, uncertainties and other factors that are difficult to predict and which may cause future results, performance or achievements to differ. These risks, uncertainties and other factors include, among others: technological developments, alternative content offerings and their effects in our markets and on consumer behavior; competition for content, audiences, advertising and distribution in a swiftly consolidating industry; the public acceptance of our brands, programs, films and other entertainment content on the various platforms on which they are distributed; the impact on our advertising revenues of declines in linear television viewing, deficiencies in audience measurement and advertising market conditions; the potential for loss of carriage or other reduction in the distribution of our content; evolving cybersecurity and similar risks; the failure, destruction or breach of our critical satellites or facilities; content theft; increased costs for programming, films and other rights; the loss of key talent; domestic and global political, economic and/or regulatory factors affecting our businesses generally; volatility in capital markets or a decrease in our debt ratings; a potential inability to realize the anticipated goals underlying our ongoing investments in new businesses, products, services and technologies; fluctuations in our results due to the timing, mix, number and availability of our films and other programming; potential conflicts of interest arising from our ownership structure with a controlling stockholder; and other factors described in our news releases and filings with the Securities and Exchange Commission, including but not limited to our 2018 Annual Report on Form 10-K and reports on Form 10-Q and Form 8-K. The forward-looking statements included in this document are made only as of the date of this document, and we do not have any obligation to publicly update any forward-looking statements to reflect subsequent events or circumstances. If applicable, reconciliations for any non- GAAP financial information contained in this news release are included in this news release or available on our website at www.viacom.com.
VIACOM INC. | ||||||||||
(in millions, except per share amounts) | Quarter Ended | |||||||||
2018 | 2017 | |||||||||
Revenues | $ | 3,090 | $ | 3,073 | ||||||
Expenses: | ||||||||||
| Operating | 1,683 | 1,563 | ||||||||
| Selling, general and administrative | 684 | 739 | ||||||||
| Depreciation and amortization | 50 | 53 | ||||||||
| Restructuring and related costs | 71 | - | ||||||||
| Total expenses | 2,488 | 2,355 | ||||||||
| Operating income | 602 | 718 | ||||||||
| Interest expense, net | (127 | ) | (147 | ) | ||||||
| Equity in net earnings of investee companies | 1 | 1 | ||||||||
| Loss on marketable securities | (46 | ) | - | |||||||
| Gain on extinguishment of debt | 18 | 25 | ||||||||
| Other items, net | (7 | ) | (4 | ) | ||||||
| Earnings from continuing operations before provision for income taxes | 441 | 593 | ||||||||
| Provision for income taxes | (110 | ) | (42 | ) | ||||||
| Net earnings from continuing operations | 331 | 551 | ||||||||
| Discontinued operations, net of tax | 3 | 2 | ||||||||
| Net earnings (Viacom and noncontrolling interests) | 334 | 553 | ||||||||
| Net earnings attributable to noncontrolling interests | (13 | ) | (16 | ) | ||||||
| Net earnings attributable to Viacom | $ | 321 | $ | 537 | ||||||
| Amounts attributable to Viacom: | ||||||||||
| Net earnings from continuing operations | $ | 318 | $ | 535 | ||||||
| Discontinued operations, net of tax | 3 | 2 | ||||||||
| Net earnings attributable to Viacom | $ | 321 | $ | 537 | ||||||
| Basic earnings per share attributable to Viacom: | ||||||||||
| Continuing operations | $ | 0.79 | $ | 1.33 | ||||||
| Discontinued operations | 0.01 | - | ||||||||
| Net earnings | $ | 0.80 | $ | 1.33 | ||||||
| Diluted earnings per share attributable to Viacom: | ||||||||||
| Continuing operations | $ | 0.79 | $ | 1.33 | ||||||
| Discontinued operations | 0.01 | - | ||||||||
| Net earnings | $ | 0.80 | $ | 1.33 | ||||||
| Weighted average number of common shares outstanding: | ||||||||||
| Basic | 403.1 | 402.5 | ||||||||
| Diluted | 403.5 | 402.6 | ||||||||
VIACOM INC. | |||||||||||
(in millions, except par value) | |||||||||||
ASSETS | December 31, | September 30, | |||||||||
Current assets: | |||||||||||
| Cash and cash equivalents | $ | 534 | $ | 1,557 | |||||||
| Receivables, net | 3,205 | 3,141 | |||||||||
| Inventory, net | 829 | 896 | |||||||||
| Prepaid and other assets | 468 | 482 | |||||||||
Total current assets | 5,036 | 6,076 | |||||||||
| Property and equipment, net | 893 | 919 | |||||||||
| Inventory, net | 3,930 | 3,848 | |||||||||
| Goodwill | 11,606 | 11,609 | |||||||||
| Intangibles, net | 305 | 313 | |||||||||
| Other assets | 974 | 1,018 | |||||||||
| Total assets | $ | 22,744 | $ | 23,783 | |||||||
| LIABILITIES AND EQUITY | |||||||||||
| Current liabilities: | |||||||||||
| Accounts payable | $ | 305 | $ | 433 | |||||||
| Accrued expenses | 732 | 848 | |||||||||
| Participants’ share and residuals | 707 | 719 | |||||||||
| Program obligations | 729 | 662 | |||||||||
| Deferred revenue | 424 | 398 | |||||||||
| Current portion of debt | 326 | 567 | |||||||||
| Other liabilities | 610 | 427 | |||||||||
| Total current liabilities | 3,833 | 4,054 | |||||||||
| Noncurrent portion of debt | 8,635 | 9,515 | |||||||||
| Participants’ share and residuals | 428 | 523 | |||||||||
| Program obligations | 437 | 498 | |||||||||
| Deferred tax liabilities, net | 274 | 296 | |||||||||
| Other liabilities | 1,174 | 1,186 | |||||||||
| Redeemable noncontrolling interest | 239 | 246 | |||||||||
| Commitments and contingencies | |||||||||||
| Viacom stockholders’ equity: | |||||||||||
| Class A common stock, par value $0.001, 375.0 authorized; 49.4 and 49.4 outstanding, respectively | - | - | |||||||||
| Class B common stock, par value $0.001, 5,000.0 authorized; 353.7 and 353.7 outstanding, respectively | - | - | |||||||||
| Additional paid-in capital | 10,154 | 10,145 | |||||||||
| Treasury stock, 393.1 and 393.1 common shares held in treasury, respectively | (20,561 | ) | (20,562 | ) | |||||||
| Retained earnings | 18,916 | 18,561 | |||||||||
| Accumulated other comprehensive loss | (839 | ) | (737 | ) | |||||||
| Total Viacom stockholders’ equity | 7,670 | 7,407 | |||||||||
| Noncontrolling interests | 54 | 58 | |||||||||
| Total equity | 7,724 | 7,465 | |||||||||
| Total liabilities and equity | $ | 22,744 | $ | 23,783 | |||||||
VIACOM INC. | ||||||||||
(in millions) | Quarter Ended | |||||||||
| 2018 | 2017 | |||||||||
| OPERATING ACTIVITIES | ||||||||||
| Net earnings (Viacom and noncontrolling interests) | $ | 334 | $ | 553 | ||||||
| Discontinued operations, net of tax | (3 | ) | (2 | ) | ||||||
| Net earnings from continuing operations | 331 | 551 | ||||||||
| Reconciling items: | ||||||||||
| Depreciation and amortization | 50 | 53 | ||||||||
| Feature film and program amortization | 1,082 | 1,047 | ||||||||
| Equity-based compensation | 9 | 14 | ||||||||
| Equity in net earnings and distributions from investee companies | 2 | 4 | ||||||||
| Deferred income taxes | (36 | ) | (91 | ) | ||||||
| Loss on marketable securities | 46 | - | ||||||||
| Operating assets and liabilities, net of acquisitions: | ||||||||||
| Receivables | (12 | ) | (93 | ) | ||||||
| Production and programming | (1,125 | ) | (1,191 | ) | ||||||
| Accounts payable and other current liabilities | (78 | ) | (232 | ) | ||||||
| Other, net | (41 | ) | (50 | ) | ||||||
| Net cash provided by operating activities | 228 | 12 | ||||||||
INVESTING ACTIVITIES | ||||||||||
| Acquisitions and investments, net | (14 | ) | (2 | ) | ||||||
| Capital expenditures | (37 | ) | (28 | ) | ||||||
| Proceeds received from asset sales | 5 | 23 | ||||||||
| Grantor trust proceeds | 2 | 2 | ||||||||
| Net cash used in investing activities | (44 | ) | (5 | ) | ||||||
FINANCING ACTIVITIES | ||||||||||
| Debt repayments | (1,100 | ) | (1,000 | ) | ||||||
| Commercial paper | - | 100 | ||||||||
| Dividends paid | (81 | ) | (80 | ) | ||||||
| Other, net | (21 | ) | (22 | ) | ||||||
| Net cash used in financing activities | (1,202 | ) | (1,002 | ) | ||||||
| Effect of exchange rate changes on cash and cash equivalents | (5 | ) | - | |||||||
| Net change in cash and cash equivalents | (1,023 | ) | (995 | ) | ||||||
| Cash and cash equivalents at beginning of period | 1,557 | 1,389 | ||||||||
| Cash and cash equivalents at end of period | $ | 534 | $ | 394 | ||||||
SUPPLEMENTAL DISCLOSURES REGARDING NON-GAAP FINANCIAL INFORMATION
The following tables reconcile our results of operations reported in accordance with accounting principles generally accepted in the United States of America (“GAAP”) for the quarter ended December 31, 2018 to adjusted results that exclude the impact of certain items identified as affecting comparability (non-GAAP). Accordingly, when applicable, we use non-GAAP measures such as consolidated adjusted operating income, adjusted earnings from continuing operations before provision for income taxes, adjusted provision for income taxes, adjusted net earnings from continuing operations attributable to Viacom and adjusted diluted earnings per share (“EPS”) from continuing operations, among other measures, to evaluate our actual operating performance and for planning and forecasting of future periods. In addition, because foreign currency headwinds can be significant and unpredictable and are outside of our control, we are providing certain financial information excluding the impact of currency fluctuations in order to provide a clearer view of our operating performance. We believe that these adjusted measures provide relevant and useful information for investors because they clarify our actual operating performance, make it easier to compare our results with those of other companies and allow investors to review performance in the same way as our management. Since these are not measures of performance calculated in accordance with GAAP, they should not be considered in isolation of, or as a substitute for, operating income, earnings from continuing operations before provision for income taxes, provision for income taxes, net earnings from continuing operations attributable to Viacom and diluted EPS from continuing operations as indicators of operating performance and they may not be comparable to similarly titled measures employed by other companies.
Quarter Ended | |||||||||||||||||||||
| (in millions, except per share amounts) | Operating | Earnings from | Provision for | Net Earnings | Diluted EPS | ||||||||||||||||
Reported results (GAAP) | $ | 602 | $ | 441 | $ | 110 | $ | 318 | $ | 0.79 | |||||||||||
Factors Affecting Comparability: | |||||||||||||||||||||
Restructuring, related costs and programming charges (2) | 148 | 148 | 34 | 114 | 0.28 | ||||||||||||||||
| Gain on extinguishment of debt (3) | - | (18 | ) | (4 | ) | (14 | ) | (0.03 | ) | ||||||||||||
| Loss on marketable securities (4) | - | 46 | 11 | 35 | 0.08 | ||||||||||||||||
| Adjusted results (Non-GAAP) | $ | 750 | $ | 617 | $ | 151 | $ | 453 | $ | 1.12 | |||||||||||
Quarter Ended | |||||||||||||||||||||
(in millions, except per share amounts) | Operating | Earnings from | Provision for | Net Earnings | Diluted EPS | ||||||||||||||||
| Reported results (GAAP) | $ | 718 | $ | 593 | $ | 42 | $ | 535 | $ | 1.33 | |||||||||||
| Factors Affecting Comparability: | |||||||||||||||||||||
Gain on extinguishment of debt (3) | - | (25 | ) | (6 | ) | (19 | ) | (0.05 | ) | ||||||||||||
Discrete tax benefit (5) | - | - | 103 | (103 | ) | (0.25 | ) | ||||||||||||||
| Adjusted results (Non-GAAP) | $ | 718 | $ | 568 | $ | 139 | $ | 413 | $ | 1.03 | |||||||||||
| (1) The tax impact has been calculated by applying the tax rates applicable to the adjustments presented. |
(2) During fiscal 2018, we launched a program of cost transformation initiatives to improve our margins. We recognized pre-tax charges of $148 million in the quarter ended December 31, 2018 associated with continuing initiatives primarily related to recent management changes and reorganization at Media Networks, comprised of $71 million of restructuring and related costs and $77 million of programming charges. The programming charges resulted from decisions by management newly in place, as part of our 2018 restructuring activities, to cease the use of certain programming, and are included within Operating expenses in the Consolidated Statements of Earnings. |
| (3) We redeemed senior notes and debentures totaling $1.128 billion in the quarter ended December 31, 2018. As a result, we recognized a pre-tax extinguishment gain of $18 million in the Consolidated Statements of Earnings. |
We redeemed senior notes and debentures totaling $1.039 billion in the quarter ended December 31, 2017. As a result of these transactions, we recognized a pre-tax extinguishment gain of $25 million in the Consolidated Statements of Earnings. |
| (4) In the quarter ended December 31, 2018, we recorded a non-operating loss on marketable securities of $46 million in the Consolidated Statements of Earnings pursuant to our adoption of Accounting Standards Update 2016-01 - Financial Instruments - Overall: Recognition and Measurement of Financial Assets and Financial Liabilities, which requires the changes in fair value measurement of marketable securities to be recognized in the Consolidated Statement of Earnings. |
| (5) Discrete tax benefits for the quarter ended December 31, 2017 were principally related to the U.S. enactment of the Tax Cuts and Jobs Act. |
The following table reconciles our net cash provided by operating activities (GAAP) for the quarters ended December 31, 2018 and 2017 to free cash flow (non-GAAP). We define free cash flow as net cash provided by operating activities minus capital expenditures. Free cash flow is a non-GAAP measure. Management believes the use of this measure provides investors with an important perspective on our liquidity, including our ability to service debt and make investments in our businesses.
Reconciliation of net cash provided by operating activities to free cash flow | Quarter Ended | Better/ | |||||||||||||||
(in millions) | 2018 | 2017 | $ | ||||||||||||||
| Net cash provided by operating activities (GAAP) | $ | 228 | $ | 12 | $ | 216 | |||||||||||
| Capital expenditures | (37 | ) | (28 | ) | (9 | ) | |||||||||||
| Free cash flow (Non-GAAP) | $ | 191 | $ | (16 | ) | $ | 207 | ||||||||||
View source version on businesswire.com: https://www.businesswire.com/news/home/20190205005426/en/
Contacts:
Justin Dini
Senior Vice President,
Corporate Communications
(212) 846-2724
justin.dini@viacom.com
